Graphs are fundamental when it comes to mathematics.
Equation outputs have patterns that make for interesting graphs when plotted out.
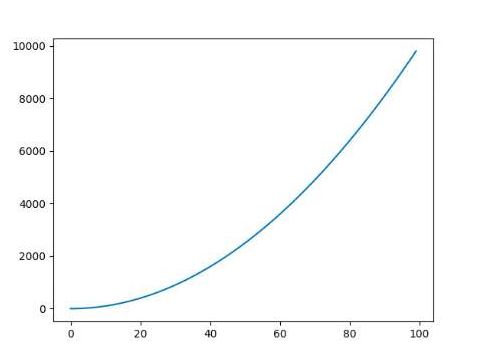
To see these graphs, begin with a simple equation: y = x2. 1. Create a function called "function1" using function declarations.
2. Pass in x and return the square of x.
3. Begin with the def keyword to create a new function with an input of list
x from before:
def function1(x):4. Create a return statement for the result of x squared:
return x * xThis function will square any value you pass it.
The values returned by function1 need to be stored somewhere.
5. Create an empty list called "data" to store these values:
data = [ ]Fill data with the squared values returned by
function1. Use a for loop to pass in all the numbers from 1 to 100.
1. Create a for loop using the range method:
for i in range(100):2. Use the list’s append function add it to the list called "data":
output = function1(i) data.append(output) import matplotlib.pyplot as plt import numpy as np3. Pass the list to a Matplotlib plot, like so:
def function1(x): return x * x
data = [ ]
for i in range(100): output = function1(i) data.append(output)
print(data)
You've graphed all the values from 1 to 100 using a for loop, but you can also do it using a NumPy function for quicker and cleaner code.
Remember the range function Python comes preloaded with?
NumPy has a
np.arange(x) function, which produces into a NumPy array from 0 to x.
This function is noninclusive, so it stops right before x.
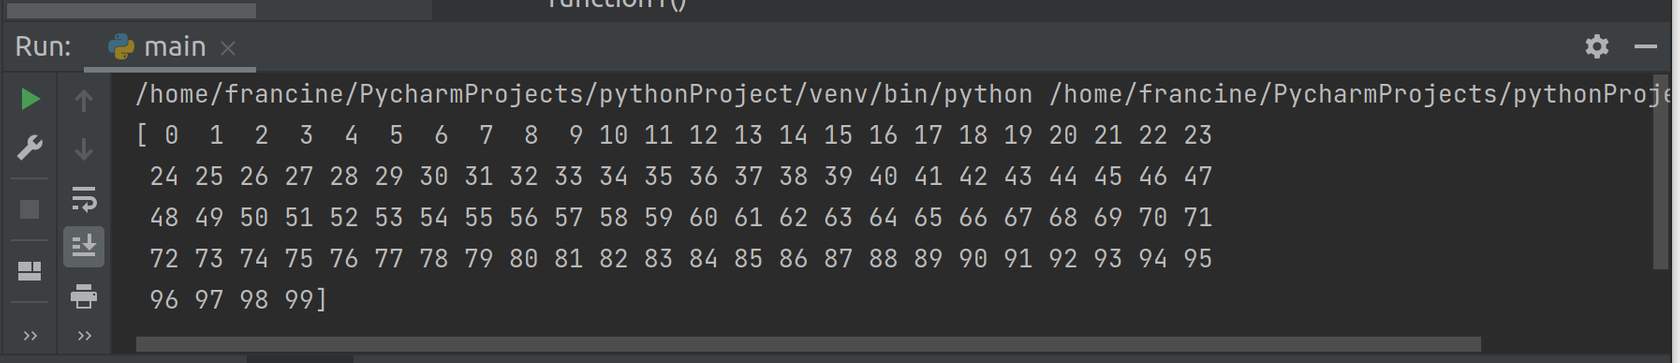
1. Call
data = np.arange(100) to return numbers from 0 to 99.
import matplotlib.pyplot as plt import numpy as npBecause NumPy arrays can have one operation performed on them rather than having to make a for loop to iterate through the whole array, you can pass it into a function as if it were a single value. 2. Pass the array
def function1(x): return x * x
data = np.arange(100) print(data)
data into function1:
output = function1(data)
3. Examine the two ways to graph the squares of all the numbers between 1 to 100.
Both work to produce the same graph, but are achieved through different techniques. Matplotlib can also be used to graph equations. There are a lot of customizable options.
- Use a different math formula besides x * x.
- The function you plotted just now is a parabola; try finding the equation of a circle and printing that, as well as a higher-order polynomial.
e.g., y = x^3 + x^2 + x.
import matplotlib.pyplot as plt
import numpy as np

def function1(x):
    return x * x

data = np.arange(100)
print(data)
output = function1(data) plt.plot(output) plt.show()