A primitive and simple CAD program I created that draws and renders 2D shapes and lines onto the console using nothing but standard libraries.
There's two ways to using this program.
First method is the original way of creating and plotting objects to the Viewport by intializing and calling prebuilt classes in the main function.There are prebuilt classes for all basic geometries you may wish to plot.
Second method is with the recently imlpemented Control Interface feature, where Shapes may be created, plotted and manipulated by commands through the terminal.
You need to first create a Screen object, initialized with the values for x_resolution and y_resolution of the display size you want. Next, you need to create a Viewport that will automatically generate a cartesian coordinate system that fits the screen. The Viewport handles all plotting and drawing functions and subsequently encodes them into data arrays. The Screen performs the rendering of this data. The render function renders three shades corresponding to 1, 0.8, 0.2, 0 (darkest to transparent).
    Screen screen(RESOLUTION_X, RESOLUTION_Y);
Viewport viewport(RESOLUTION_X, RESOLUTION_Y);The Point class is provided for creating points that are initialized with their x and y coordinates on the Viewport. Any point that falls outside of the displayed coordinates will not be rendered. The plot must be plotted onto the viewport after creation by using the plotPoint() method of the Viewport (pass by refrence). To see the point rendered, use the renderToFile() method of Screen and pass the return value of the getViewportData() method of Viewport. Alternately use render() method to render right to console.
    Point pt1(12,36);
    viewport.plotPoint(&pt1); //Plots point onto viewport cartesian plane
    screen.renderToFile(viewport.getViewportData()); //Passes image data to Screen to be rendered into a .txt file
The point has a Translate() method that takes in parameters (int x_distance, int y_distance) corresponsing to the desired translation.
    Point pt1(12,36);
    pt1.Translate(5,5) //Translates the point 5 to right and 5 up
    viewport.plotPoint(&pt1);
screen.renderToFile(viewport.getViewportData());The Line class can be used to create vectors of Points that trace a line between two desired Point Objects. Alternately the Line object can be created without passing Point objects to it and instead the coordinate pairs ({int x1, int y1}, {int x2, int y2}). Use plotObject() method to plot line by passing the Line object to it.
    Line line1({2, 2}, {10, 10}); //Line from (2,2) to (10,10)
    viewport.plotObject(line1); //Plots all points belonging to line onto viewport
    screen.renderToFile(viewport.getViewportData()); //render
The Circles class takes in two parameters: center and radius. One option is to pass the center as a Point Object along with an int value of radius. Alternately, a coordinate pair may be passed for x_center and y_center along with int radius.
    Circle circle({RESOLUTION_X / 2, RESOLUTION_Y / 2}, 50); //creates circle at centre of screen with radius=50
    viewport.plotObject(circle);  //plot circle points onto viewport
    screen.renderToFile(viewport.getViewportData()); // render
You can plot two types of Bezier curves: Quadratic and Cubic. The former takes in parameters for three control points whereas the latter takes four. Pass the parameters as pairs of coordinates for your points.
    Bezier quadratic({10,10}, {50, 50}, {100,10}); //Start (10,10), ControlPoint (50,50), End (100,10)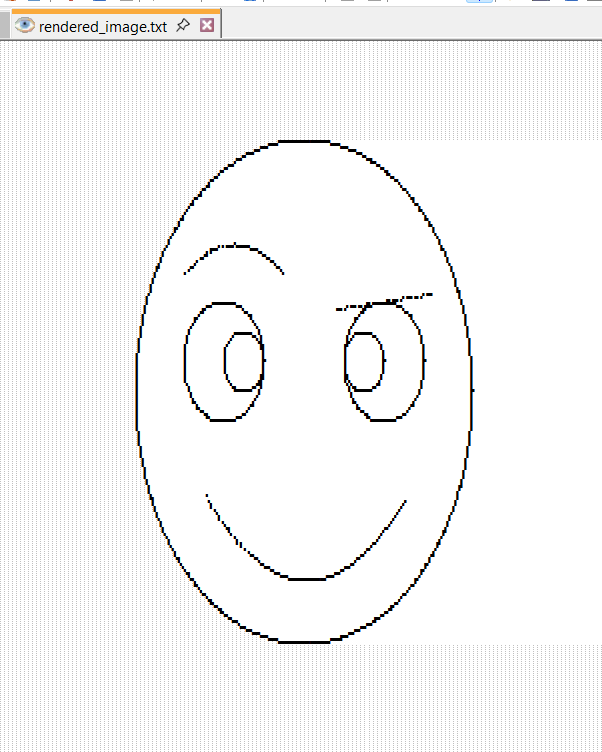
Bezier cubic({10,10}, {30, 50}, {60, 0}, {100,10}); //Start (10,10), ControlPoint1 (30,50), ControlPoint2 (60,0), End (100,10)RESOLUTION_X = 481px, RESOLUTION_Y = 280px
    Screen screen(RESOLUTION_X, RESOLUTION_Y);
    Viewport viewport(RESOLUTION_X, RESOLUTION_Y);

    Circle head({RESOLUTION_X / 2, RESOLUTION_Y / 2}, 100);
    viewport.plotObject(head);

    Circle eyeR({RESOLUTION_X / 2 + 20, RESOLUTION_Y / 2 + 20}, 20);
    viewport.plotObject(eyeR);
    Circle eyeL({RESOLUTION_X / 2 - 20, RESOLUTION_Y / 2 + 20}, 20);
    viewport.plotObject(eyeL);

    Circle pupilR({RESOLUTION_X / 2 + 10, RESOLUTION_Y / 2 + 20}, 10);
    viewport.plotObject(pupilR);
    Circle pupilL({RESOLUTION_X / 2 - 10, RESOLUTION_Y / 2 + 20}, 10);
    viewport.plotObject(pupilL);

    Line mouth({RESOLUTION_X / 2 + 20, RESOLUTION_Y / 2 - 35}, {RESOLUTION_X / 2 - 20, RESOLUTION_Y / 2 - 45});
    viewport.plotObject(mouth);

    screen.renderToFile(viewport.getViewportData());
IT IS RECOMMENDED TO USE TEXT EDITORS WITH AUTO-REFRESH FEATURES WHEN USING CONTROL INTERFACE FOR A SMOOTHER EXPERIENCE (Notepad++)
Similar to Method 1, you need to first create a Screen object, initialized with the values for x_resolution and y_resolution of the display size you want. Additionally you also need to create a Viewport.
    Screen screen(RESOLUTION_X, RESOLUTION_Y);
Viewport viewport(RESOLUTION_X, RESOLUTION_Y);To use the Interface program in the console, you need to create a Control Interface object and initialize it with the already created Screen and Viewport objects. Additionally, you need to create a hashmap with key type string, and value type Shape*, for storing any Shapes that will be created during your session.
    unordered_map<string, Shape *> ShapeStorage;
ControlInterface(screen, viewport, ShapeStorage);To create a Shape, use the following command format:
shape_type shape_name
Where shape_type can be: c for Circle, l for Line, b for Bezier,
and shape_name can be any string corresponding to a unique name for this Shape. For Example:
PCAD> c newcircle
This creates a circle called newcircle. After this command, the interface automatically takes your through the creation wizard for that shape, prompting you to input the relevant parameters necessary for creating the Shape. After the Shape is created, the program automatically enters edit mode for the created Shape.
PCAD> l line            //Command for creating Line
Start (x, y): 0 0       //Creation Wizard
End (x, y): 100 100
line>                   //edit mode for 'line'
To select a already existing Shape for editing, use the same command format as for creation:
shape_type shape_name
Where shape_type is the type of the target Shape: c for Circle, l for Line, b for Bezier,
and shape_name is the name of the target Shape.
PCAD> l line        //'line' is already created, so it gets selected
line>               //edit mode for 'line'
To exit edit mode, enter 0.
To translate the Shape along x-axis, enter tx and enter amount to translate by.
To translate the Shape along y-axis, enter ty and enter amount to translate by.
The program stays in translation mode until you exit it by entering 0.
line> tx            //Enter translation_x mode
line tx> 50         //Translate by 50px right
line tx> -20        //Translate by 20px left
line tx> 0          //Exit translation mode
line> 0             //Exit edit mode
PCAD>               //Back to main menu
To scale the Shape along x-axis, enter sx and enter amount to scale by.
To scale the Shape along y-axis, enter sy and enter amount to scale by.
To scale the Shape uniformly along both axis, enter s and enter amount to scale by. This is default scaling method for Circles.
The program stays in scaling mode until you exit it by entering 0.
line> s            //Enter uniform scaling mode
line s> 2          //Scale by 2
line s> 0.5        //Scale by 0.5
line s> 0          //Exit scaling mode
line> 0            //Exit edit mode
PCAD>              //Back to main menu
1- Added control interface for drawing and editting shapes using commands.
PCAD> l line
Start (x, y): 0 0
End (x, y): 100 100
2- Added origin property to all shapes which is the geometric centre of the Shape represented as a coordinate pair.
3- Removed deprecated vector from viewport class called displayed_shapes and gave that name to Shapes hashmap.
4- Changed name of the parent class geometricObject to Shape.
1- Completely re-implemented the way Shapes are rendered in viewport. Previously, only the Points of all the Shapes were stored in Viewport memory and rendered accordinly. This prevented any dynamic editting of Shapes that were already plotted as all data about Shape Points was lost. Now, all Shapes are stored in Viewport using a hashmap that maps all the Shapes to their Points. Shapes are now edittable objects and any change in shape line_points vector can be dynamically updated in viewport by calling the encodePoints() method.
    Circle circle({20, 20}, 50);
    viewport.plotObject(circle); //Stores the generated points of the circle in Viewport hashmap
    viewport.displayed_shapes[&circle] = {}; //Wiping all the points that map to the circle in Viewport Shapes hashmap
    viewport.encodePoints(); //Updating all the Points in memory to viewport data. Here, this erases the circle.
2- Added translate and scaling methods for all current shape objects (lines, circles and bezier curves). You may now use the encodePoints() method to update your changes to the Shape.
    Circle circle({20, 20}, 50);
    viewport.plotObject(circle); //Stores the generated points of the circle in Viewport hashmap
    circle.translate({50,50}); //Translate circle by (50, 50)
    circle.scale(2); //Scale circle by factor of 2
viewport.encodePoints(); //Updating all the Points in memory to viewport data. Here, this scales and translates the circle.1- Added Quadratic and Cubic Bezier curves that can be created and initialized using class Bezier({x1, y1}, {x2, y2}, {x3, y3}) (add {x4, y4} for cubic).
2- Changed the parameter types of lines and circles from seperate x, y values for points to coordinate pairs.
    Circle circle1(20, 20, 100); //Before
    Circle circle1({20, 20}, 100); // After
3- Changed the paramter type of the plotObject() Viewport method from a getLinePoints() function call to pass by refrence. You may now pass the object itself to the method.
    viewport.plotObject(circle.getLinePoints()); //Before
viewport.plotObject(circle); //AfterCleaned up the Viewport class by removing deprecated debugging methods. Switched to using pairs for storing displayed points data. Switched to parametric equations to generate lines and circles, reducing the code for each from around 20 lines to just 5.
    for (int x = centre_x - (radius / sqrt(2)); x < centre_x + ((radius / sqrt(2)) + 1); x++)
    {
        int y_upper = centre_y + sqrt((pow(radius, 2)) - pow((x - centre_x), 2));
        int y_lower = centre_y - sqrt((pow(radius, 2)) - pow((x - centre_x), 2));
        Point *point_upper = new Point(x, y_upper);
        Point *point_lower = new Point(x, y_lower);
        line_points.push_back(point_upper);
        line_points.push_back(point_lower);
    }
    for (int y = centre_y - (radius / sqrt(2)); y < centre_y + ((radius / sqrt(2)) + 1); y++)
    {
        int x_right = centre_x + sqrt((pow(radius, 2)) - pow((y - centre_y), 2));
        int x_left = centre_x - sqrt((pow(radius, 2)) - pow((y - centre_y), 2));
        Point *point_right = new Point(x_right, y);
        Point *point_left = new Point(x_left, y);
        line_points.push_back(point_right);
        line_points.push_back(point_left);
} for (double t = 0; t < (2 * 3.1415); t += 1.0 / radius)
{
int x = centre_x + radius * cos(t);
int y = centre_y + radius * sin(t);
Point *point = new Point(x, y);
line_points.push_back(point);
}-
Scale and Rotate functions for entire Viewport
-
Rectangles and Polygons
-
3D Graphics
Generates a checked bg but lags a lot at high resolutions.
Clears all points and makes Viewport completely blank again.
Clears all the data in the Viewport data array (sets all values to 0).
Re-encodes all the shapes and points stored in Viewport into the viewport data array