A statistical analysis on the variation of location-based weather forecasts
Joe.Duffy.Weather.Accuracy.mp4
Is there any algorithm that matches the weather predicted to the weather that actually happened?
In other words, is there any way we can gauge the accuracy of different met offices?
- Joe Duffy, Liveline 07 March 2023, RTE R1
There is now. Welcome to Safety in Numbers.
This repo relates to my ISE submission project. The goal of the project is to evaluate the most accurate weather forecasting model for my location, using a number of metrics including wind speed, wind direction, temperature, pressure and more. Work began on the project in September 2022, with this repo created on October 4. The project was submitted in April 2023, although work is still ongoing to improve the data. The submitted report may be found here.
I work as a sailing instuctor. It's an incredible job that allows me to make money doing what I love. As a sailing instructor, I have a huge amount of responsibility. I am in charge of a group of up to ten sailors, with a wide variance in age, and I am tasked with their safety at all times. A crucial aspect of this is knowing the forecasted weather so that decisions can be made that ensure the safety of every sailor. For this, an accurate weather forecast is essential. However, throughout my years of sailing and instructing, I have noticed a wide variance between weather models, sometimes to the extreme. Therefore, I wanted to make a comparison between a range of weather models in order to evaluate which was the most accurate for use at my sailing club.
The most important metric that I wanted to assess was wind speed. Sailing is entirely dependent on the amount of wind during a given day, and an excess of wind can be highly dangerous. Other metrics I was interested in include wind direction, temperature, pressure and precipitation.
To begin, I researched what weather models I would include in my analysis. Selection criteria was as follows:
- Provides weather forecasts for the island of Ireland.
- Provides access to an API.
- Does not charge for use of their API.
Based on this criteria, I selected 7 weather forecasting models.
| Model | Provider |
|---|---|
| Accuweather | accuweather.com |
| AerisWeather | rapidapi.com/aerisweather |
| ECMWF | met.ie |
| Harmonie | met.ie |
| OpenWeatherMap | openweathermap.org |
| Visual Crossing Weather | rapidapi.com/visual-crossing-corporation |
| WeatherBit | weatherbit.io |
I was particularly interested in the accuracy of the models used by Met Eireann, as that is the forecast recommended for use by instructors.
To read about my implementation, check out the report submitted to ISE.
The most important class is src/WeatherAPI. This contains the code running on the Pi at home which queries and uploads the forecast data into a database. The other classes consist of helper classes and scripts related to databases and data comparison.
Note: Throughout this section, "range" refers to the length of time into the future each model predicts.
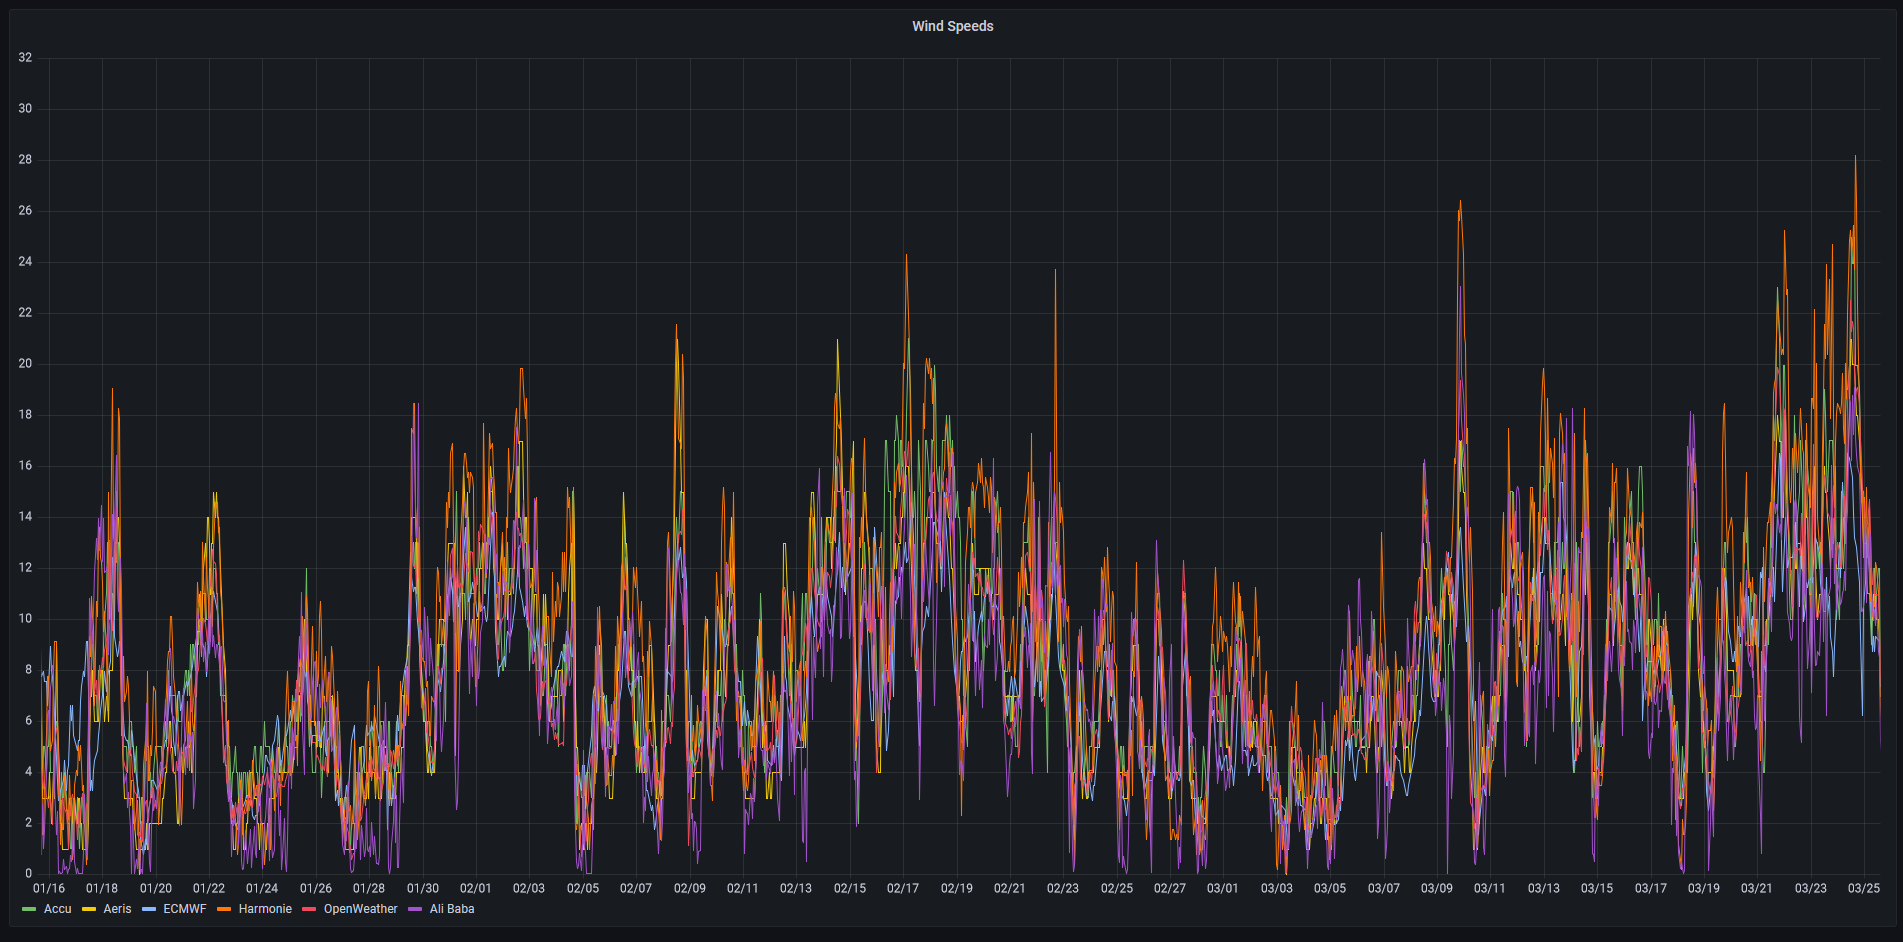
Figure 1. Graph of predicted wind speeds, with the ground truth in purple.
The graph above displays the predicted wind speeds of each model, along with the ground truth in purple. A clear correlation can be seen, which serves to validate the programmes collection logic. However, there is at times a large variance between models for the same time period. This proves that models don't always agree, which justifies my reasoning for undertaking this project in the first place.
This data relates to Offset = 0, the first hour from the forecast. In order to explore how each forecast's varies as they predict further into the future, I next graphed the absolute error from ground truth against forecast offset.
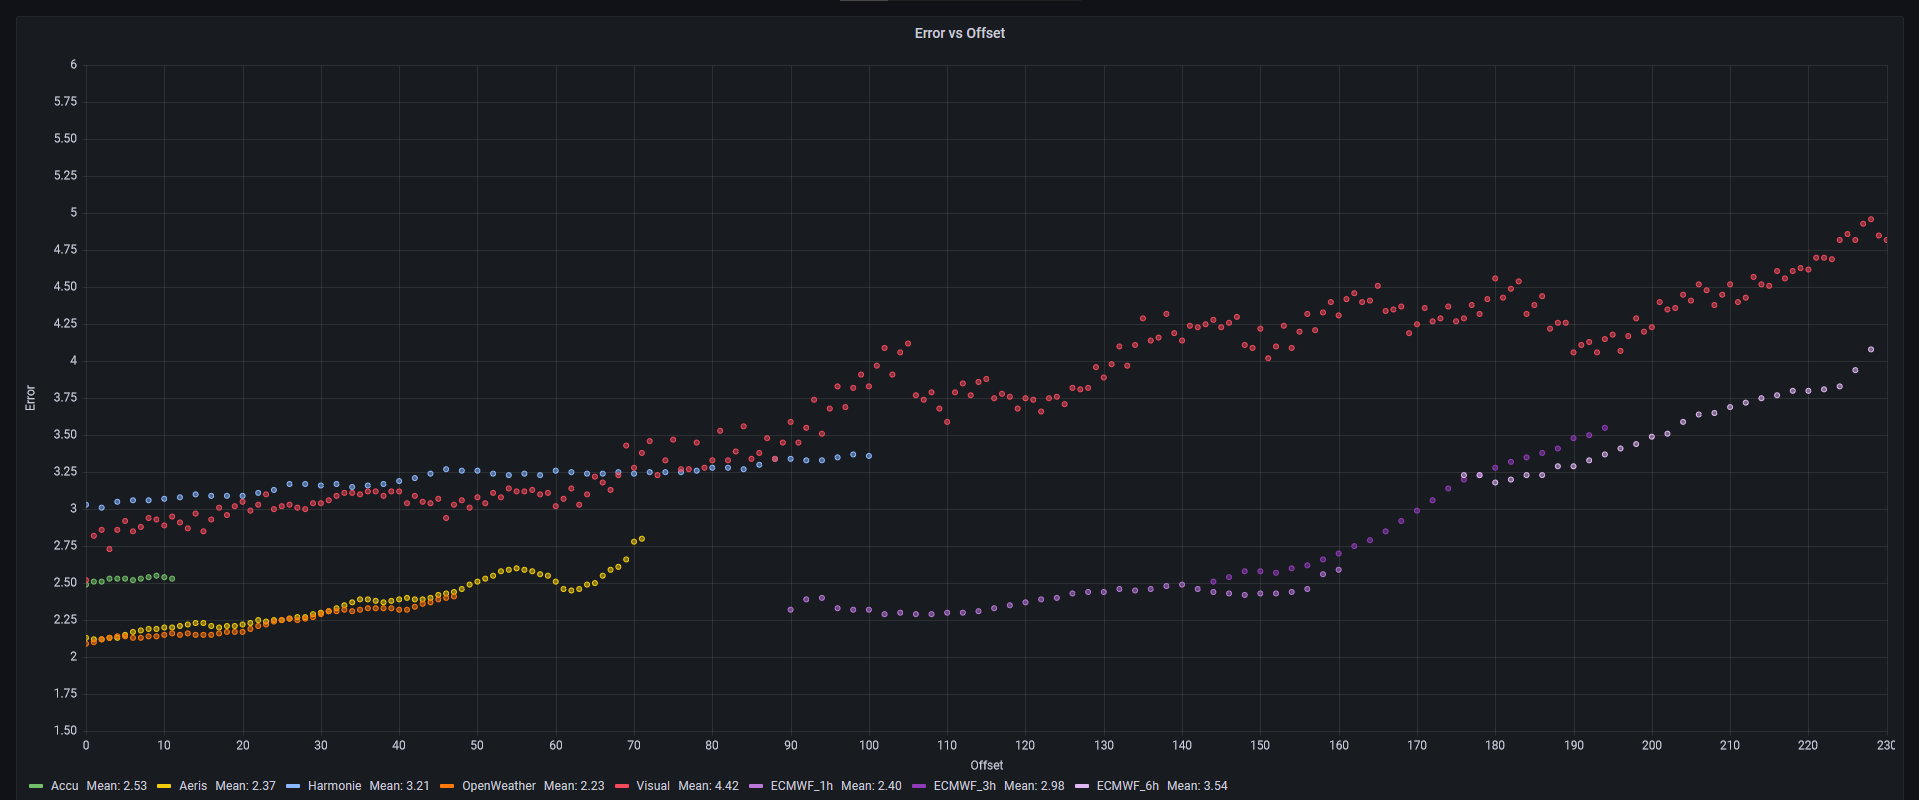
Figure 2. Graph of absolute wind speed error against offset.
We can make several conclusions from the data above.
- First, the most accurate model appears to be OpenWeatherMap, closely followed by AerisWeather. The mean error for OpenWeatherMap is 2.23 knts, while AerisWeather's is 2.37 knts. They both provide short-range forecasts, predicting 2 and 3 days into the future respectively.
- In general, it appears that models only providing short-range forecasts are more accurate over that range. Visual Crossing Weather predicts over 300 hours into the future, but gets quite inaccurate as it does so.
- All models get less accurate the further into the future they predict. This makes logical sense. It is harder to predict how a weather system will evolve over long periods of time.
- The most interesting pattern I found was Met Eireann's use of multiple models. For the first several days, they use a model called Harmonie. After a set number of hours, they switch to a model ran by the European Centre for Medium-Range Weather Forecasts (ECMWF). However, what is fascinating is the change in accuracy after switching models. Harmonie has a mean error of 3.21, while ECMWF_1h has a mean of 2.4, even 90h into the future. In other words, Met Eireann's forecast is more accurate at long ranges than short ones. Based on this data, their forecast would be more accurate if they were to use ECMWF from the very begining, instead of switching halfway through.
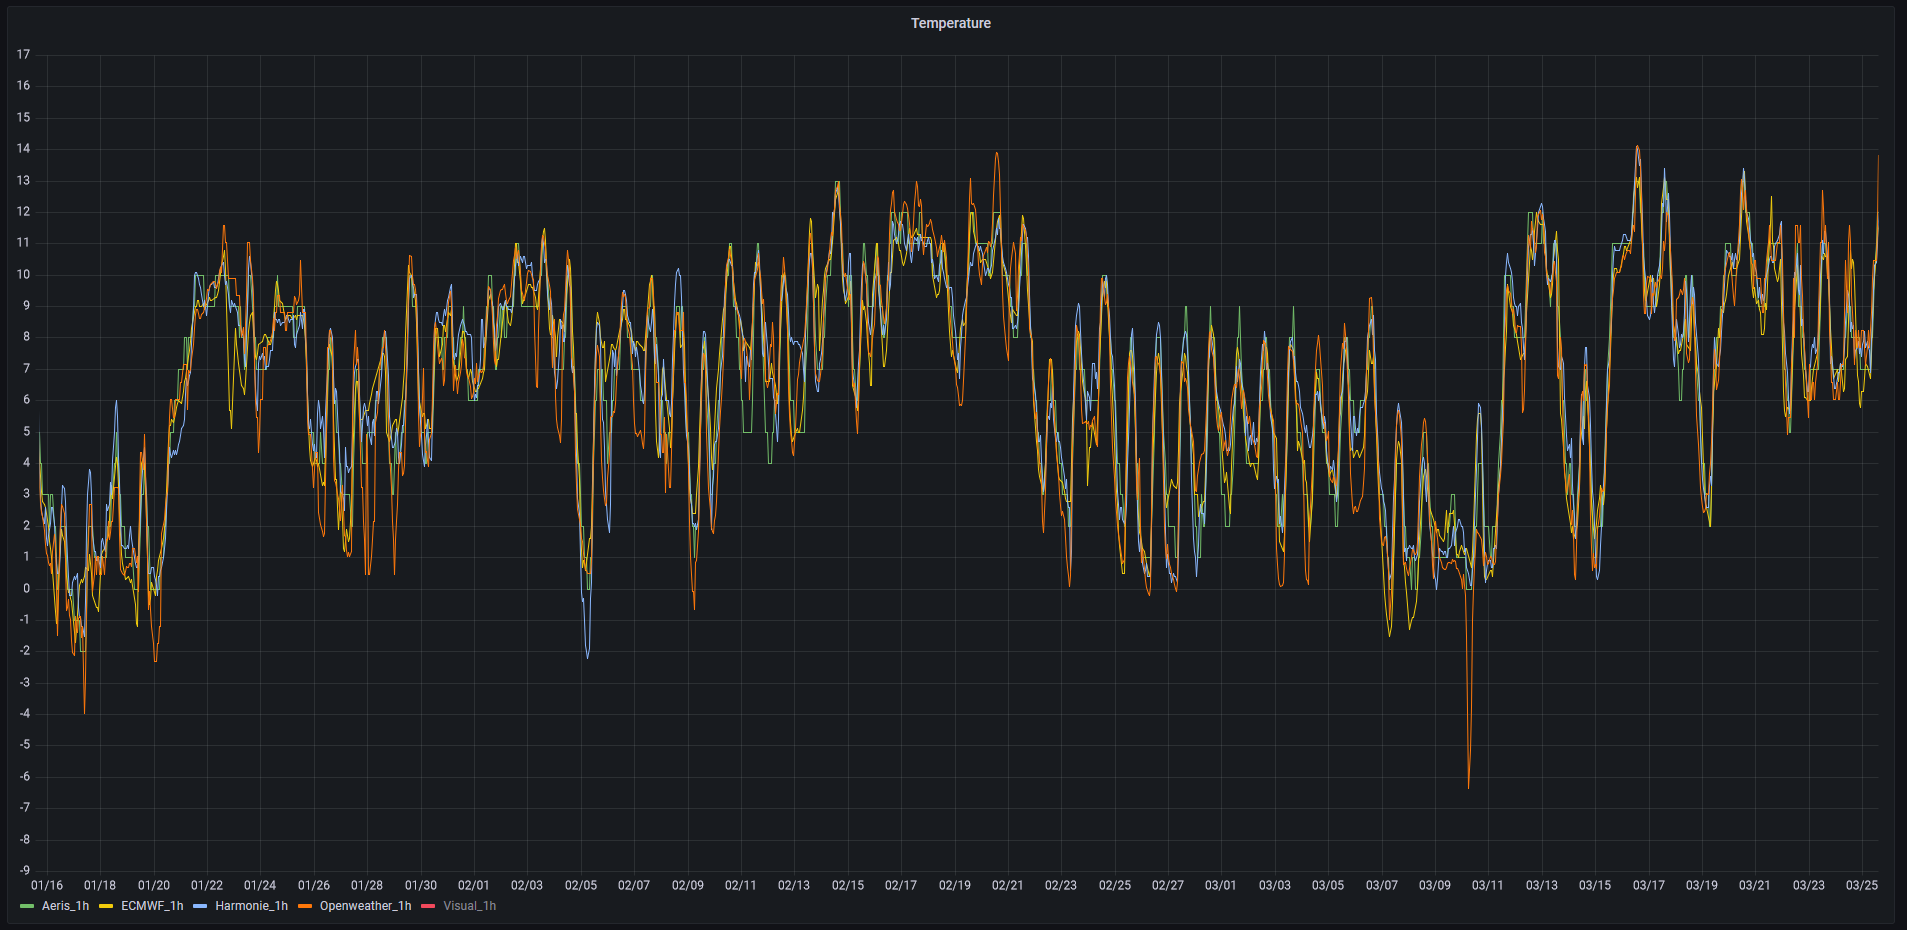
Figure 3. Graph of predicted temperature.
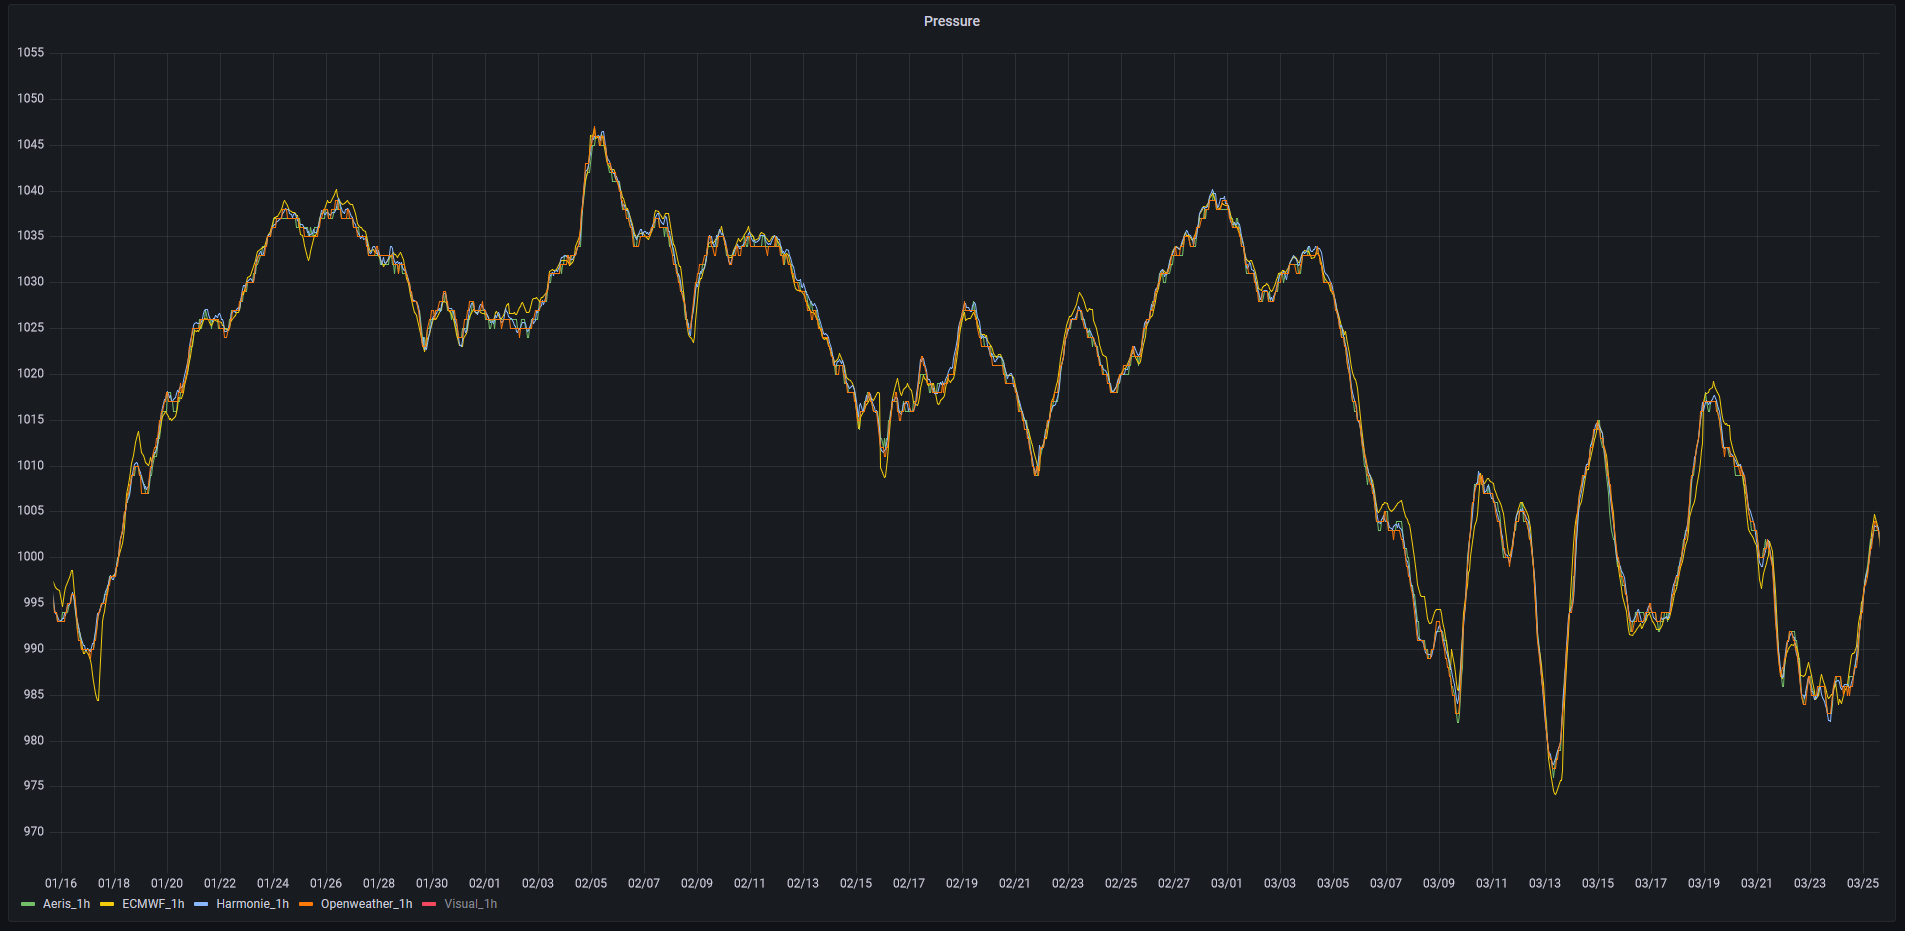
Figure 4. Graph of predicted pressure.
Graphing temperature and pressure, we can see a much closer correlation between models. These metrics seem easier to predict, especially at short ranges. This in itself is interesting: even though the models are predicting the same value for temperature and pressure, they do not necessarily agree on wind speed and direction, even though pressure heavily influences the wind.
Direction is a tricky metric to deal with. Even graphing it is difficult; being an angle, it is circular. 0° and 360° are the same. This can be clearly seen below.
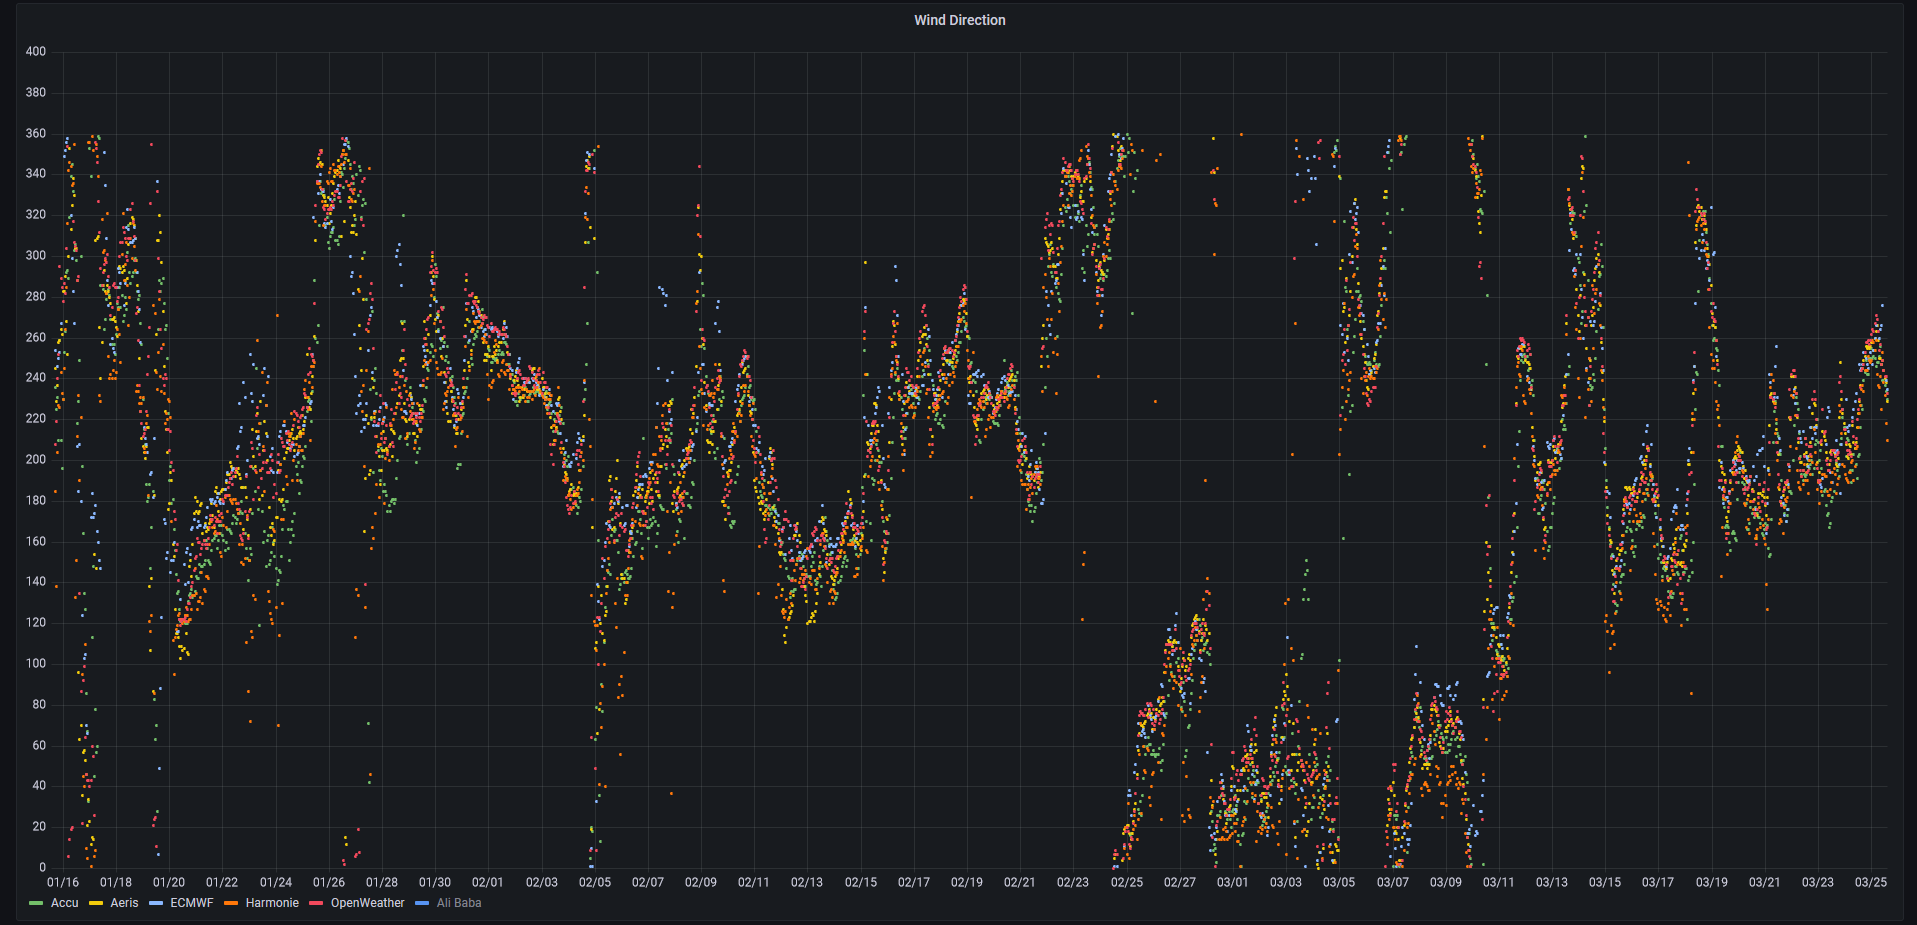
Figure 5. Graph of predicted wind speed. Irregularities can be seen due to the circular nature of wind direction.
In the above graph, there are several clusters that seem out of place. They don't quite fit into the trends of the graph. I discovered that if I repeat the graph, these clusters fit in perfectly with each other, as shown below.
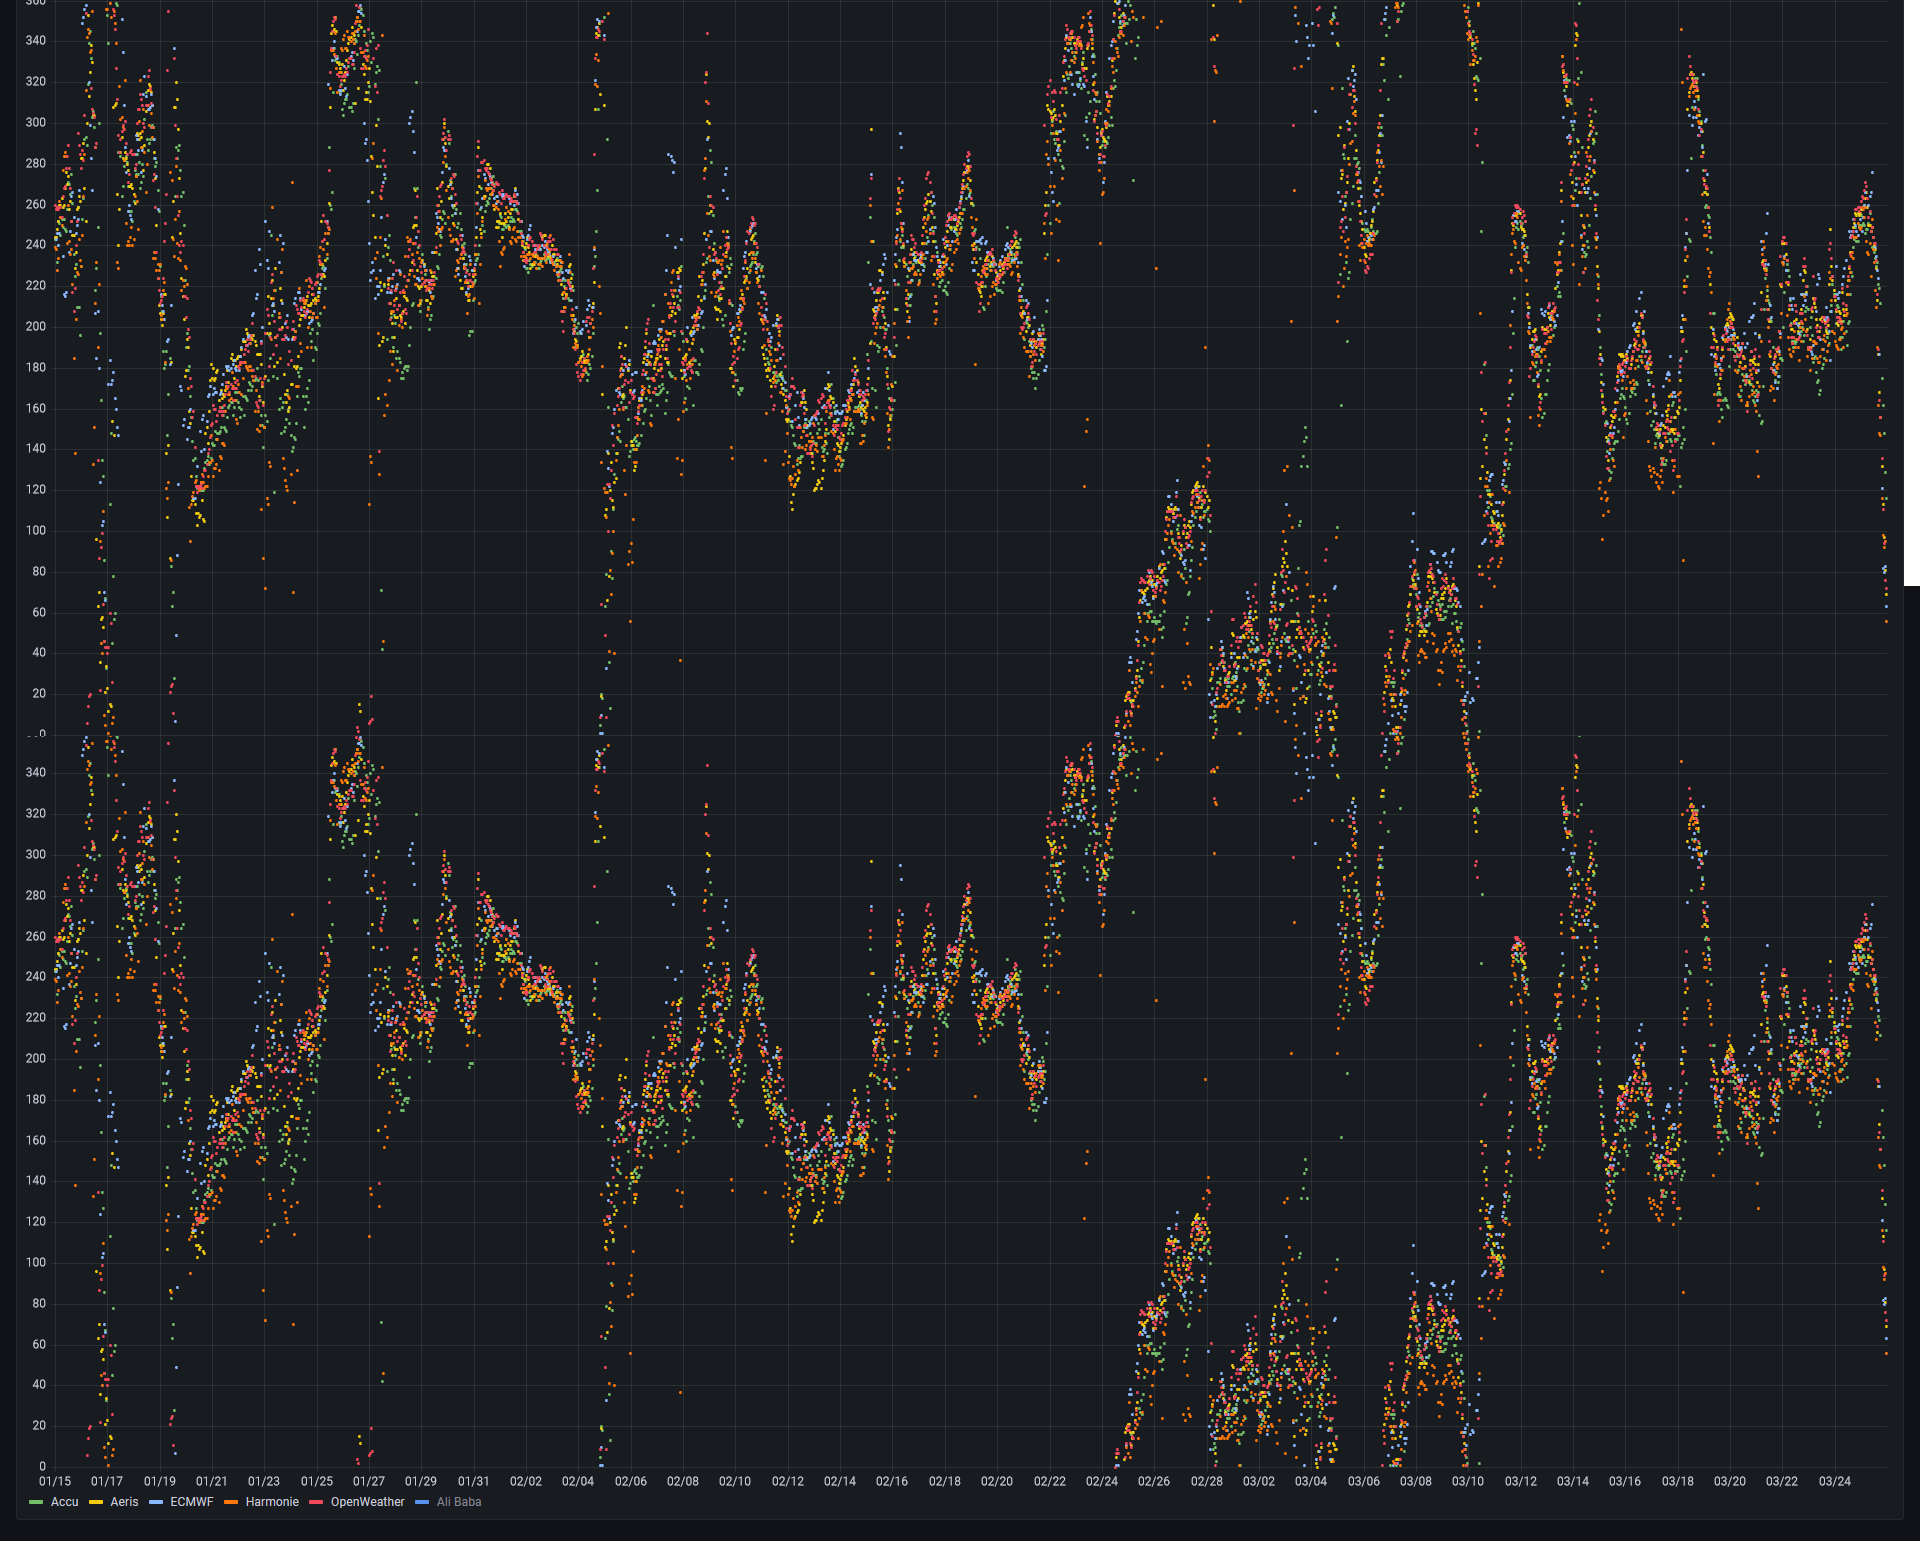
Figure 6. Doubled graph of predicted wind speed. The original irregularities now match with the data around them.
Another issue associated with working with angles is averaging. One cannot simply find the arithmetic mean of a set of angles; the mean of 359° and 1° should be 0°, not 180°. I did not realise this in my initial agregation logic. Therefore, the ground truth direction data is not correct when aggregated. When graphed, it seems completely random and scattered.
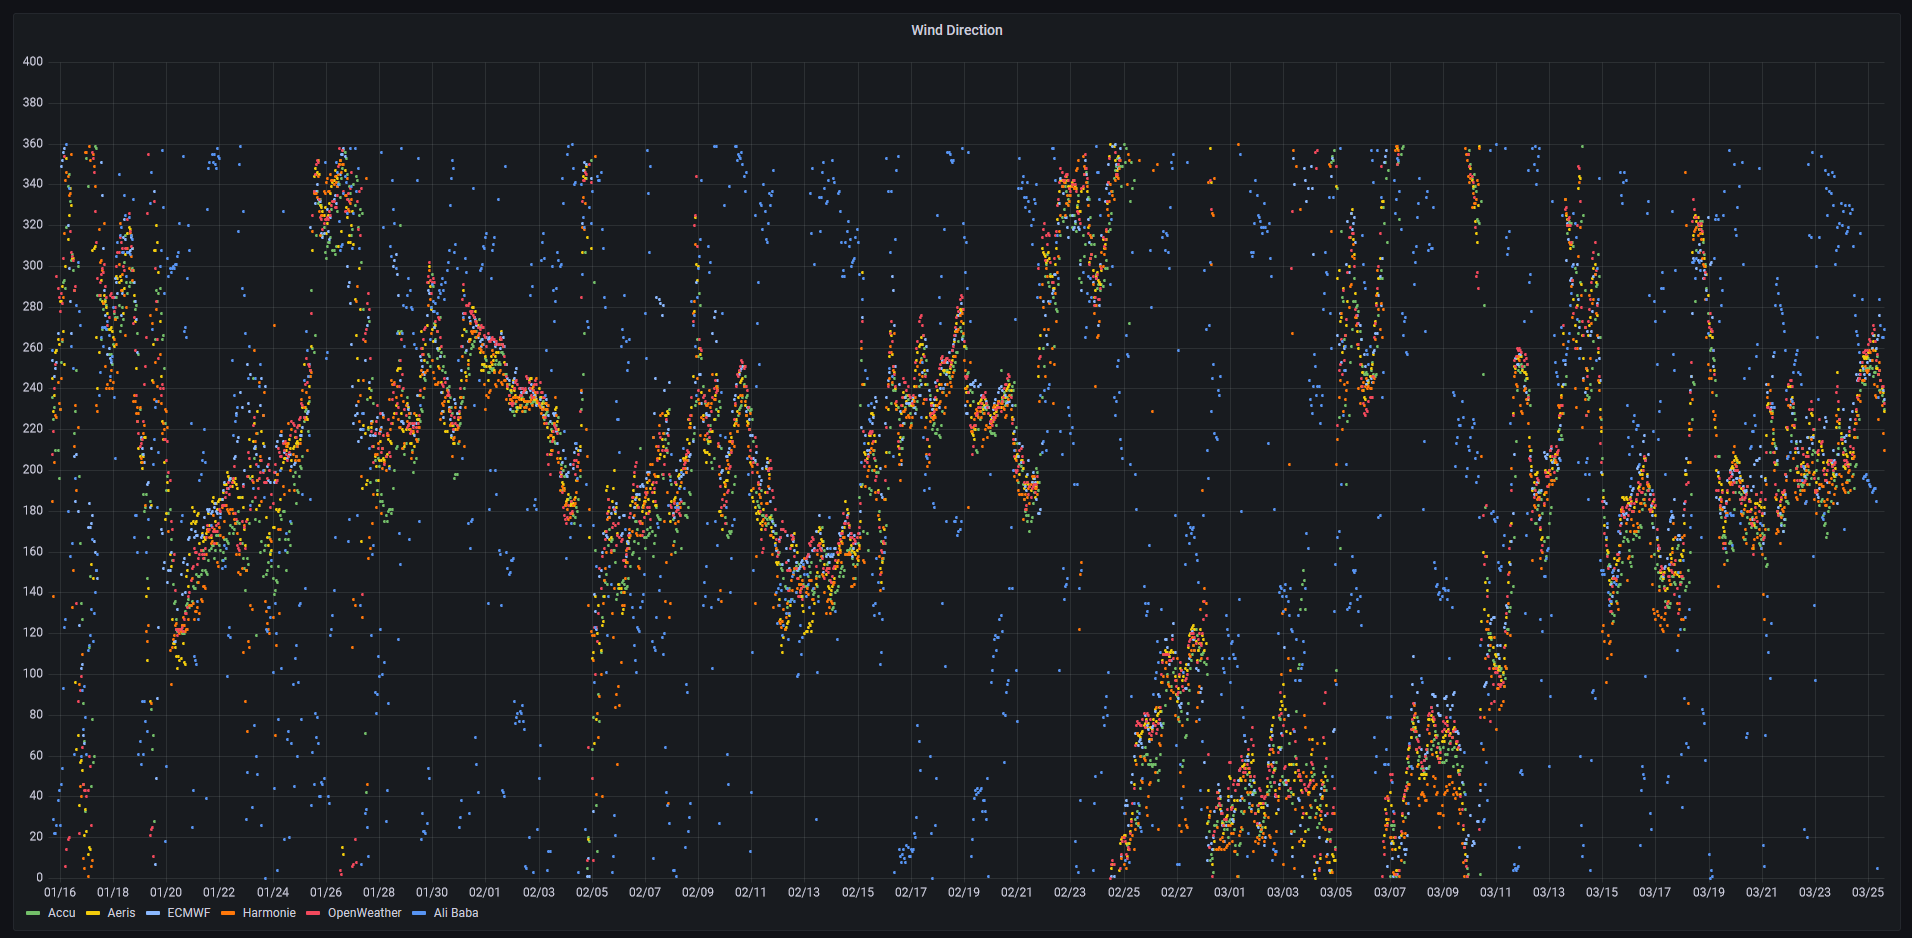
Figure 7. Graph of predicted wind speed including the ground truth in blue. The ground truth data appears random and uncorrelated.
I researched this topic and tried various methods, however none of them returned data that seemed correct. This will remain a point to work on into the future.
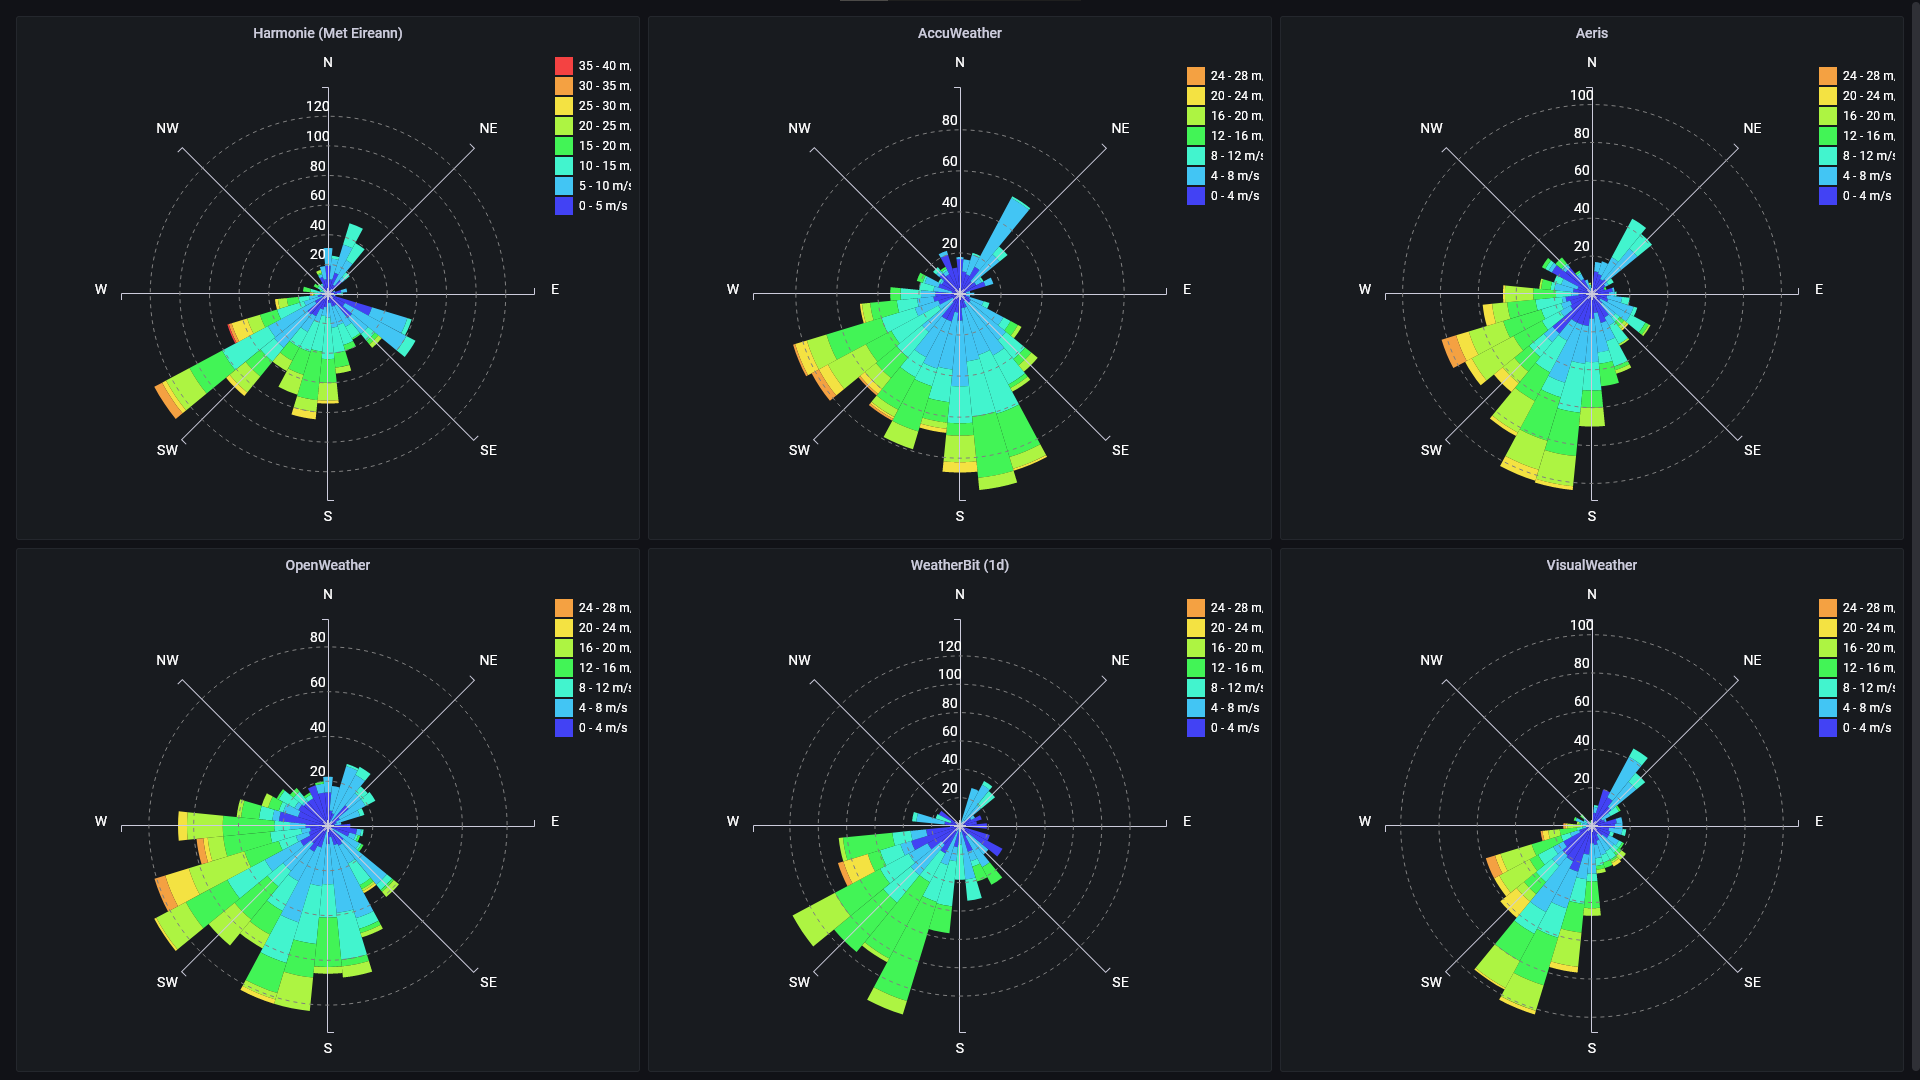
While displaying direction data over time is difficult, there is another representation which uses frequency to display data. Wind roses have been used since the 13th century by Spanish and Italien sailors. They display the frequency of wind from each direction and speed over a certain time period. I found a fantastic Grafana plugin to display wind roses on a dashboard, which was created by Spectraphilic.
Figure 8. Wind roses of multiple models over the time period.
From the above data, I have concluded that OpenWeatherMap is the best model for short-range forecasting, up to 48h, for my location. This is assuming wind speed is the most important factor for the user. For further into the future, ECMWF from Met Eireann is the most optimal.
I intend to share my findings with the members of my local club so that they too may avail of an accurate forecast. What comes of this will depend on how the project evolves. If I can prove its accuracy, there may be good reason to create my own weather app that uses my discoveries.
This has been a highly enjoyable project which has incorporated so many technologies. I have gained experience in serial connections, wiring into a raspberry pi, working with databases and more. At the begining of this project, I did not even use any IDE; I was still using the Processing for Java editor (many thanks to Processing. They were my first true exposure to programming). Since September, I have improved my programming abilities across so many fields, and I would like to thank ISE for encouraging developers to demonstrate their abilities in such a novel way.
As with any code, there are sure to be some bugs throughout my codebase. The direction aggregation is just one example of this. I hope any mistakes did not affect the data to a measureable degree, but I cannot guarantee that the code is error-free.
Additionally, callibration error is a very real possibility on the weather station. I hope to recalibrate the wind gauges in the near future in order to remove this as a source of error.
There is still much that can be done to imporve this work. First, I want to fix the issues with the direction aggregation so that I can incorporate wind direction into the data. I also want to install a temperature probe, barometer and rain gauge on the weather station in order to compare more metrics to their predicted values. More weather models will be added over time, which should be a breeze due to how I have configured the data parser.
Also rewrite it in Rust.
Thanks for reading, and may the wind be in your sails!