
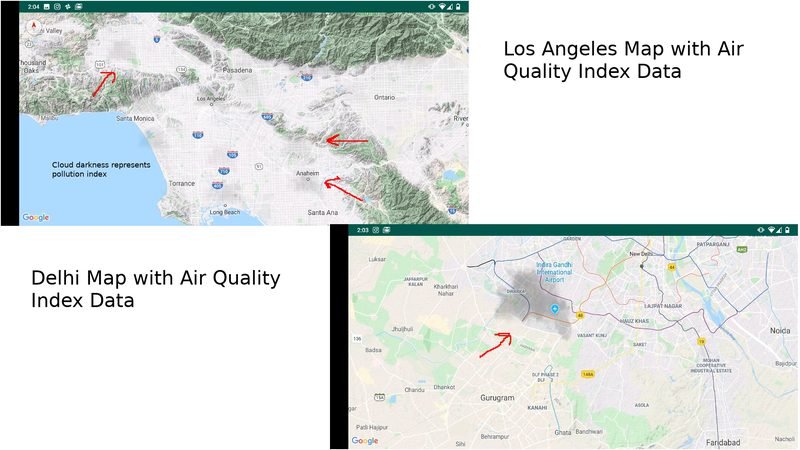
Data visualization all from different sources combined into a single index which is then passed onto the (supposedly) user friendly android app
- 5 Technology Geeks.
- All Software developers.
- Mainly focused on minimalistic UI for visualization of data.
- We'll keep updating it with interesting and creative facts to give the user a "fun while learning" vibe.
- From the given data. We remove missing and out of range values (can maybe implement imputation techniques or the EM algo).
- A python script watches the current directory and processes newly added files which conform to its data formatting.
- All the pollutant data is then averaged over 24hr and then we calculate the air quality index based on "A formula that we'll update in the future".
- All of this is then updated in the folder watched by the php script. The previous data gets moved into a history log.
- API can deliver the latest 5 readings for a present location, latest 1 reading and all the readings by far in the history log(not optimized at all xD).
- The Sentinel 5p has the exact targeted data needed for complete AQI calculation. Just need a script to get that data regularly and away we go.
- Redundant data can be eliminated easily for visualization purposes but for research we need to look at much more "Science" data.
-
ServerSIDE:
- Scripts for realtime data fetch
- Use aggregated features for insights
- Use previous years data for today's predictions... LSTM
- Use epa gov resources for more data
- Add more formulae to get the most out of raw data
- Clean the db monthly and dump history into a json
- Add direct API calls for public data access
- Switch to something "NOT sql"
-
appSIDE:
- Use flutter?
- Decide a color theme
- SMOOTHER UI, CANT STRESS ENUF
- Dashboard with graphs, pie charts and animated metrics, look smexy
- Tabbed UI alongwith the dashboard for history and live map
- Improve the map dynamics and animations
- In-app helpful tips and popups
- Fetch tips from server? Better and flexible updation
- Notification popups? might be annoying tho
- Homescreen widget
- If possible get data directly from NASA sats with models prebuilt into the app to make it standalone iwthout relying on or servers.