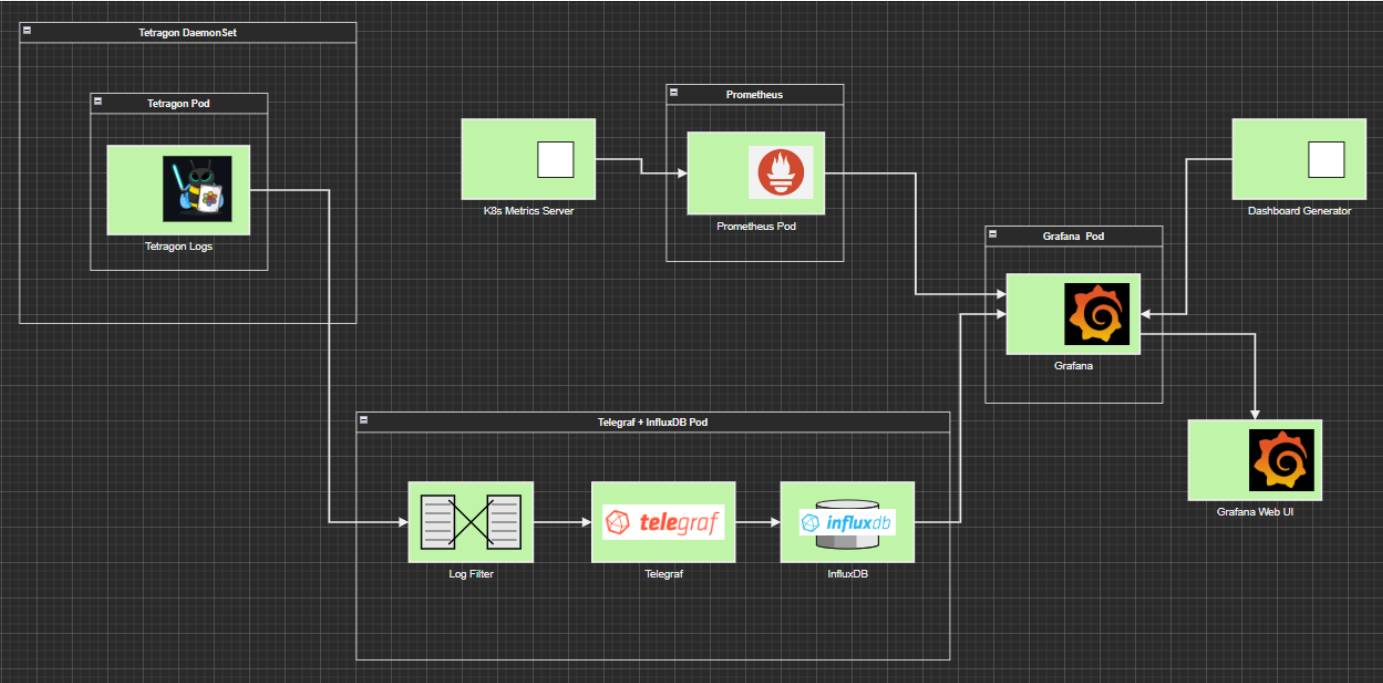
kovenant is a plug-and-play cluster-monitoring setup that combines higher-level metrics gathered via Prometheus with lower-level metrics gathered via Tetragon.
"Setup" in this context means fully configured data-monitoring pipelines with auto-generated Kubernetes-aware Grafana dashboards.
Note about directories in this repo: Everything that isn't in the install directory is just being stored for backup/reference and is not needed for installing kovenant.
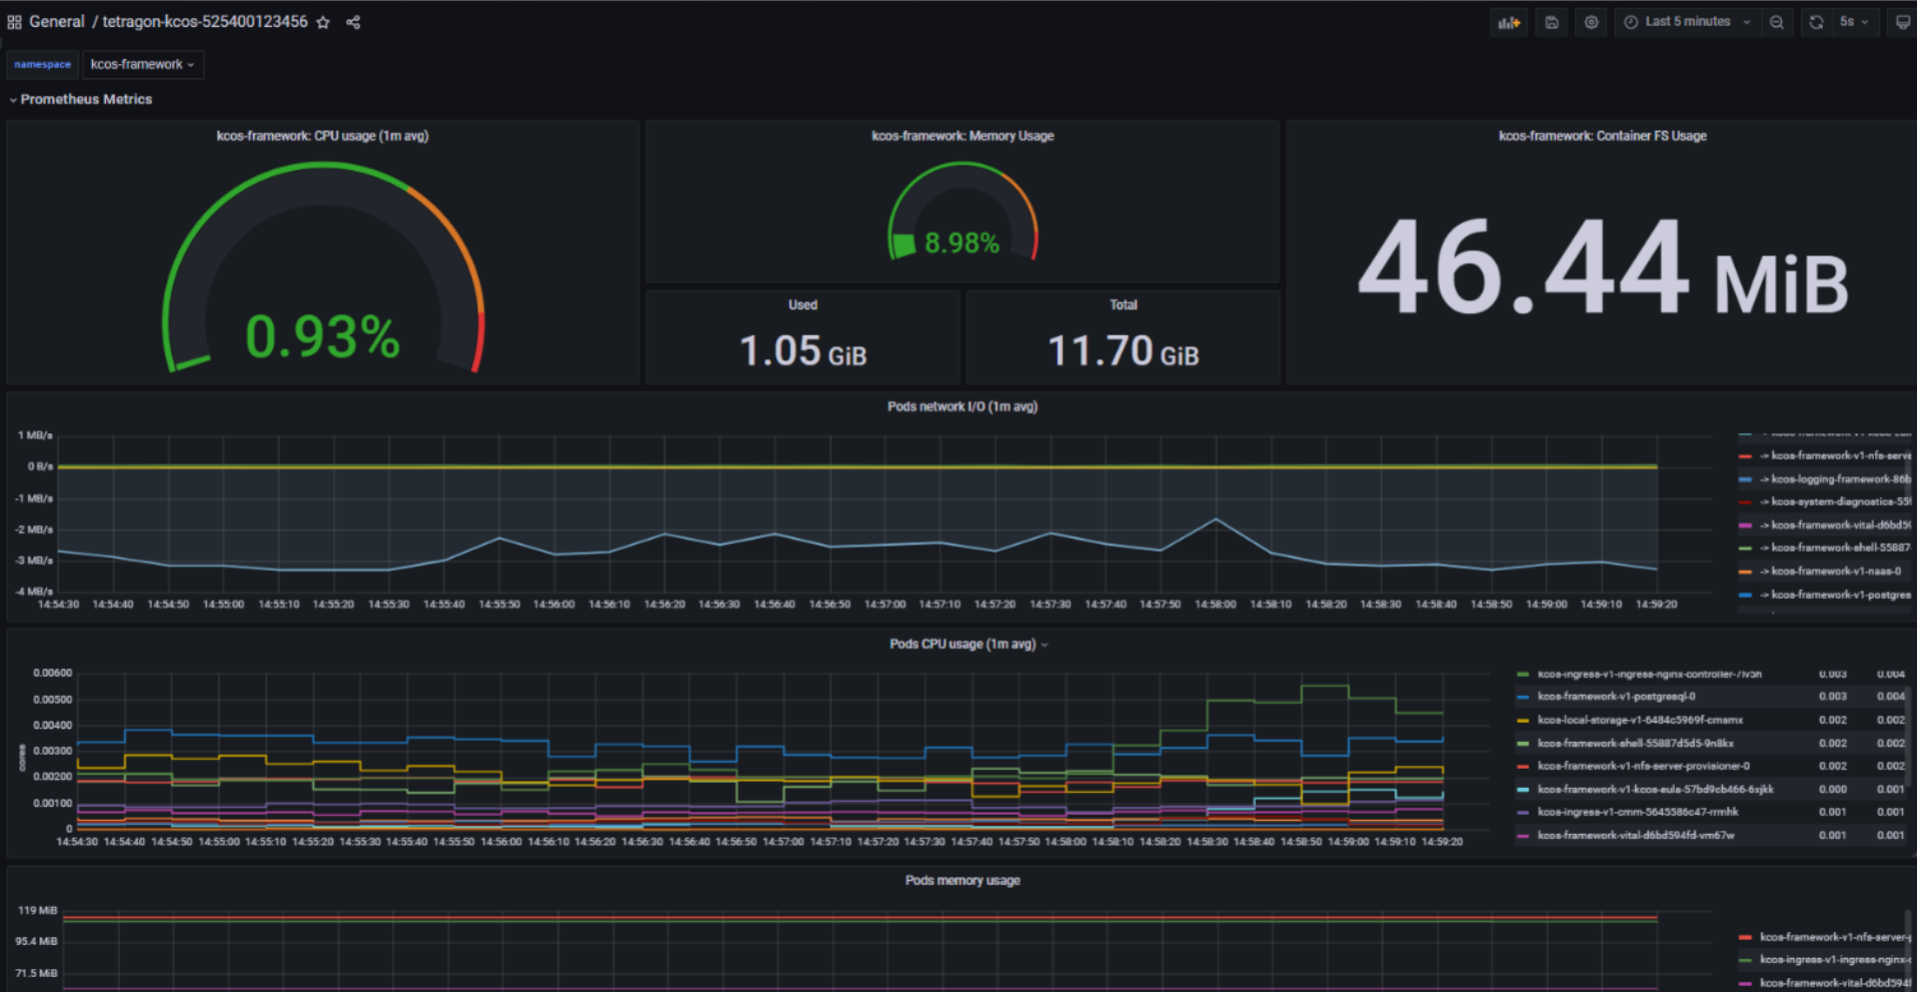
- General cluster health monitoring -> CPU, memory, filesystem usage and high-level network IO
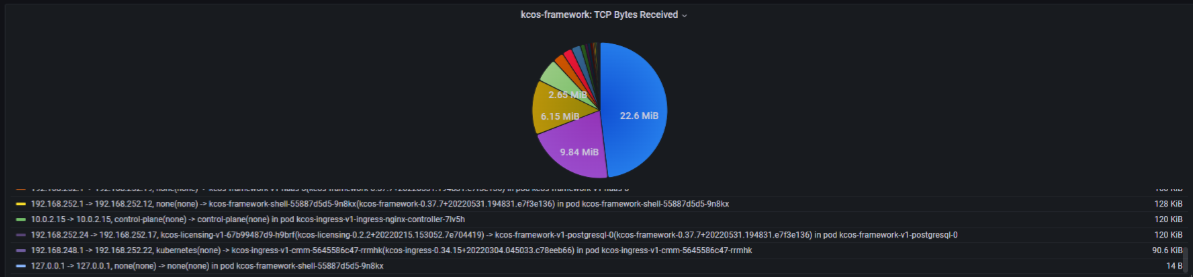
- Observation of network traffic flow between objects in the cluster
- Observation of network traffic between the cluster and external sources
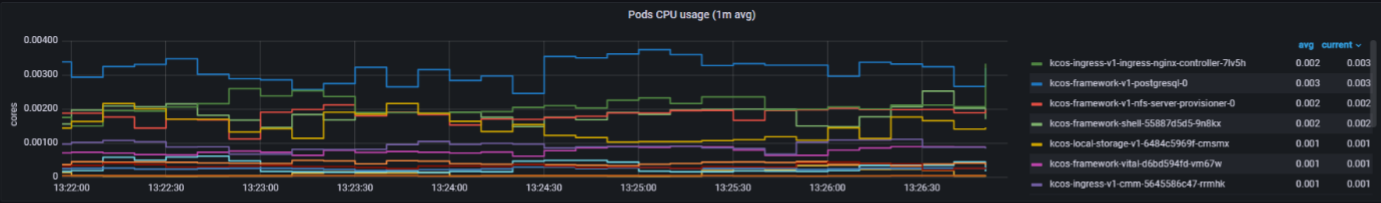
- Ability to pinpoint high-resource usage at a namespace and pod level
K8s version should be v1.19 or greater for Ingress objects.
Make sure helm and helmfile are installed.
Install the helm diff plugin with helm plugin install https://github.com/databus23/helm-diff.
From within the install directory:
cp example_dotenv .envand replace the variables in the new file as desired.cd ./telegraf_imagedocker build --network=host . -t telegraf-tetragon-tiThis image contains telegraf, kubectl, utility scripts for processing Tetragon's logs, and telegraf configuration.cd ..(back ininstalldirectory)./install.sh- After installation the Grafana UI will be available on
http://localhost/grafanaand externally onhttp://<external-base-url>/grafana, assuming the host machine doesn't have any special rules for external access.
Run ./uninstall.sh from the install directory to remove kovenant from your cluster.
- Tetragon official Helm release
- Prometheus official Helm release
- Grafana official Helm release
tetragon-ti(working name) custom Helm release- ConfigMap for env variables
- Service for communication between InfluxDB and Grafana
- One pod
- telegraf container with kubectl, Tetragon log processing scripts, etc
- InfluxDB container
- Default Prometheus metrics
- Tetragon
- TCP data is collected through kprobes on the
tcp_connect,tcp_close,tcp_sendmsg, andtcp_recvmsgkernel functions. These traces include the direction of traffic (from IP to IP), the amount of data transferred (for sends and receives), and the pod+namespace of the process that called those functions. The preprocessing scripts in the custom telegraf container add extra K8s awareness such as IP to K8s object mappings and K8s object to Helm release mappings. - General read/write data is collected through kprobes on the
__x64_sys_writeand__x64_sys_readkernel functions.
- TCP data is collected through kprobes on the
Tetragon has a CRD called TracingPolicy. In a TracingPolicy you specify either a kprobe or tracepoint (eBPF event hook) by name as well as the arguments to the function/tracepoint that you want to be captured. There are a number of other parameters that can be set. Details can be found in the Tetragon GitHub repo.
Example:
apiVersion: cilium.io/v1alpha1
kind: TracingPolicy
metadata:
  name: "tcp"
spec:
  kprobes:
  - call: "tcp_connect"
    syscall: false
    args:
     - index: 0
       type: "sock"
Running kubectl logs -n kube-system ds/tetragon -c export-stdout -f will provide a stream of Tetragon logs in json. Each time a process from a pod in the cluster
triggers a TracingPolicy you've applied, a new log will be output.
Tetragon itself just provides the logs, which must be processed for whatever your particular usecase is.