Add debug-only component tree inspector#779
Conversation
Introduces an interactive overlay panel for visualizing the live component
tree during development. The inspector is fully gated behind kDebugMode
and tree-shaken from release builds.

Features:
- Live component tree with auto-refresh after each build cycle
- Detail panel showing type, depth, state fields, DOM attributes, hydration status
- Element picking with highlight overlay
- Search/filter by component name
- Source file navigation via DDC metadata (VS Code, Cursor, IntelliJ, WebStorm)
- Keyboard navigation (arrow keys, Enter)
- Resizable panels with persisted layout

Framework additions:
- Element.debugCreationStack / debugBuildOwnerElement for build-owner tracking
- RenderObject.debugWasHydrated for SSR vs CSR origin detection
- State.debugDescribeState() hook for exposing state to the inspector
- Debug-only $jasprProjectInfo server endpoint for package path resolution
|
To view this pull requests documentation preview, visit the following URL: Documentation is deployed and generated using docs.page. |
Package Version ReportThe following packages have been updated: |
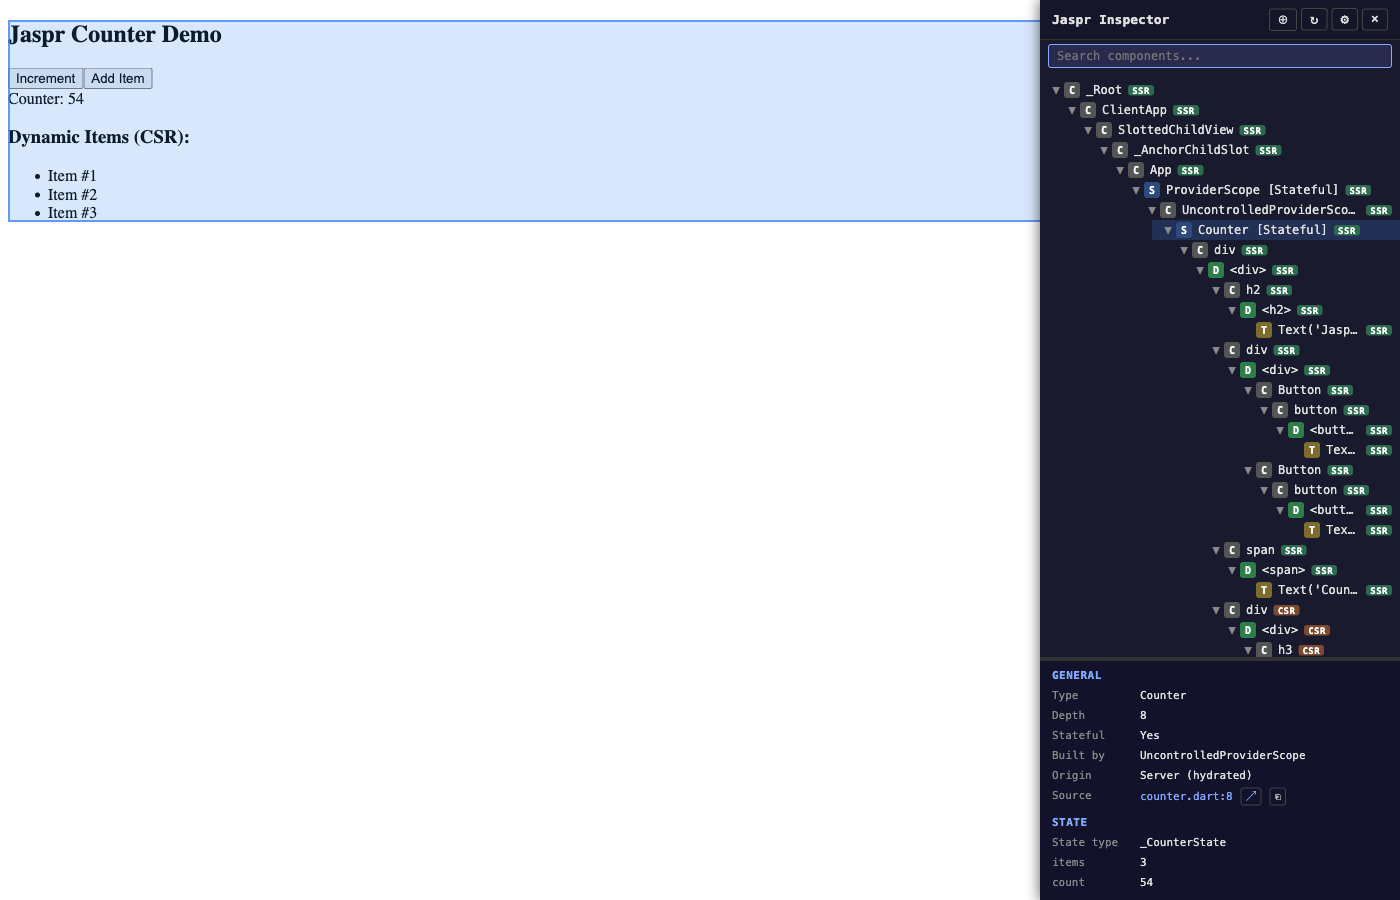
Screenshots1. Component Tree — SSR vs CSR origin badgesFull component tree showing server-rendered (green SSR) and client-rendered (orange CSR) nodes side by side. Stateful Counter component selected with live state fields (
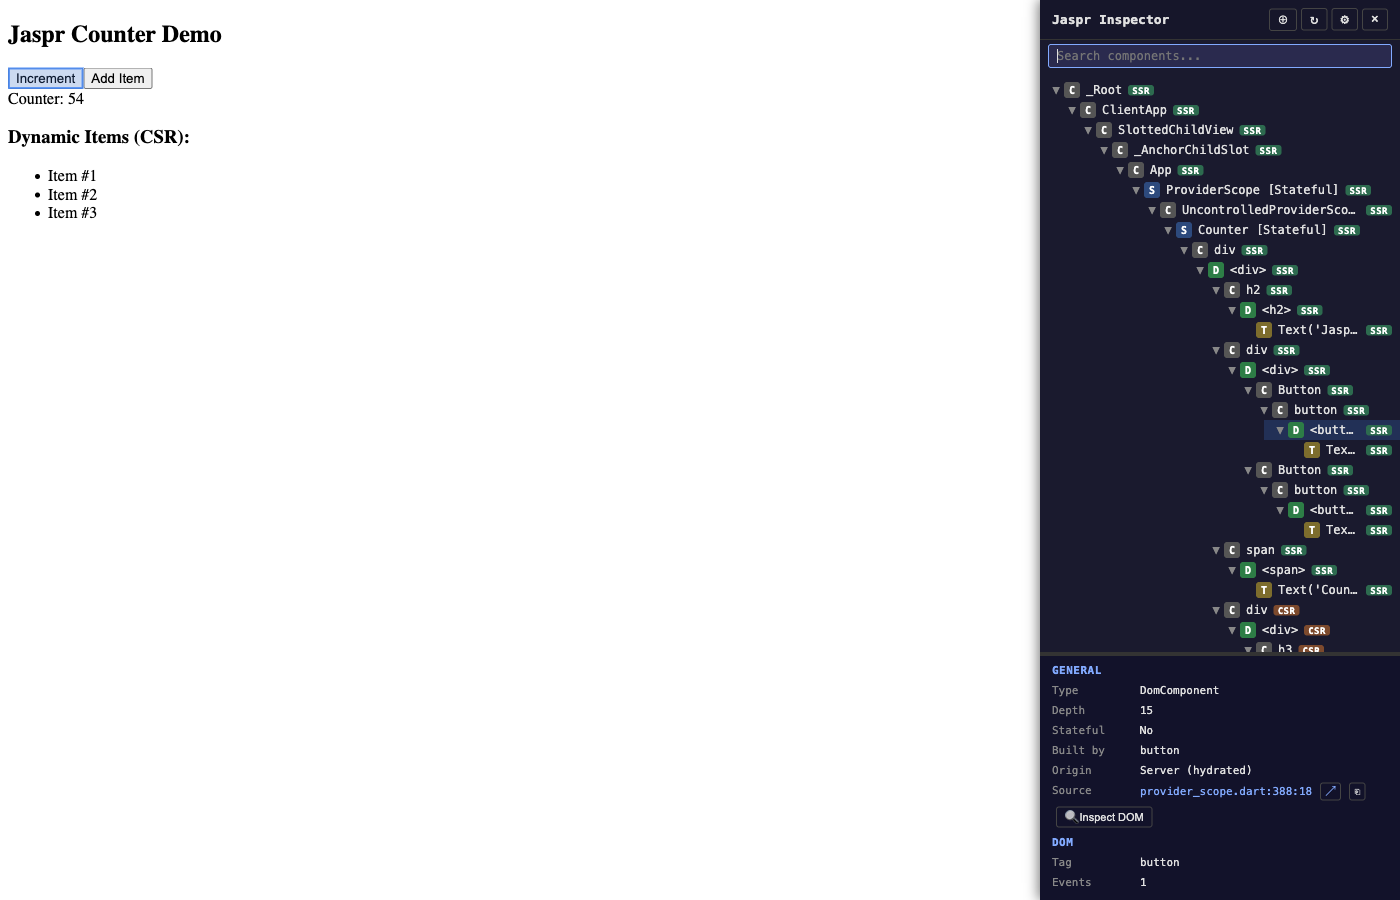
2. DOM Element Detail — Events, Source location, Inspect DOMSelecting a
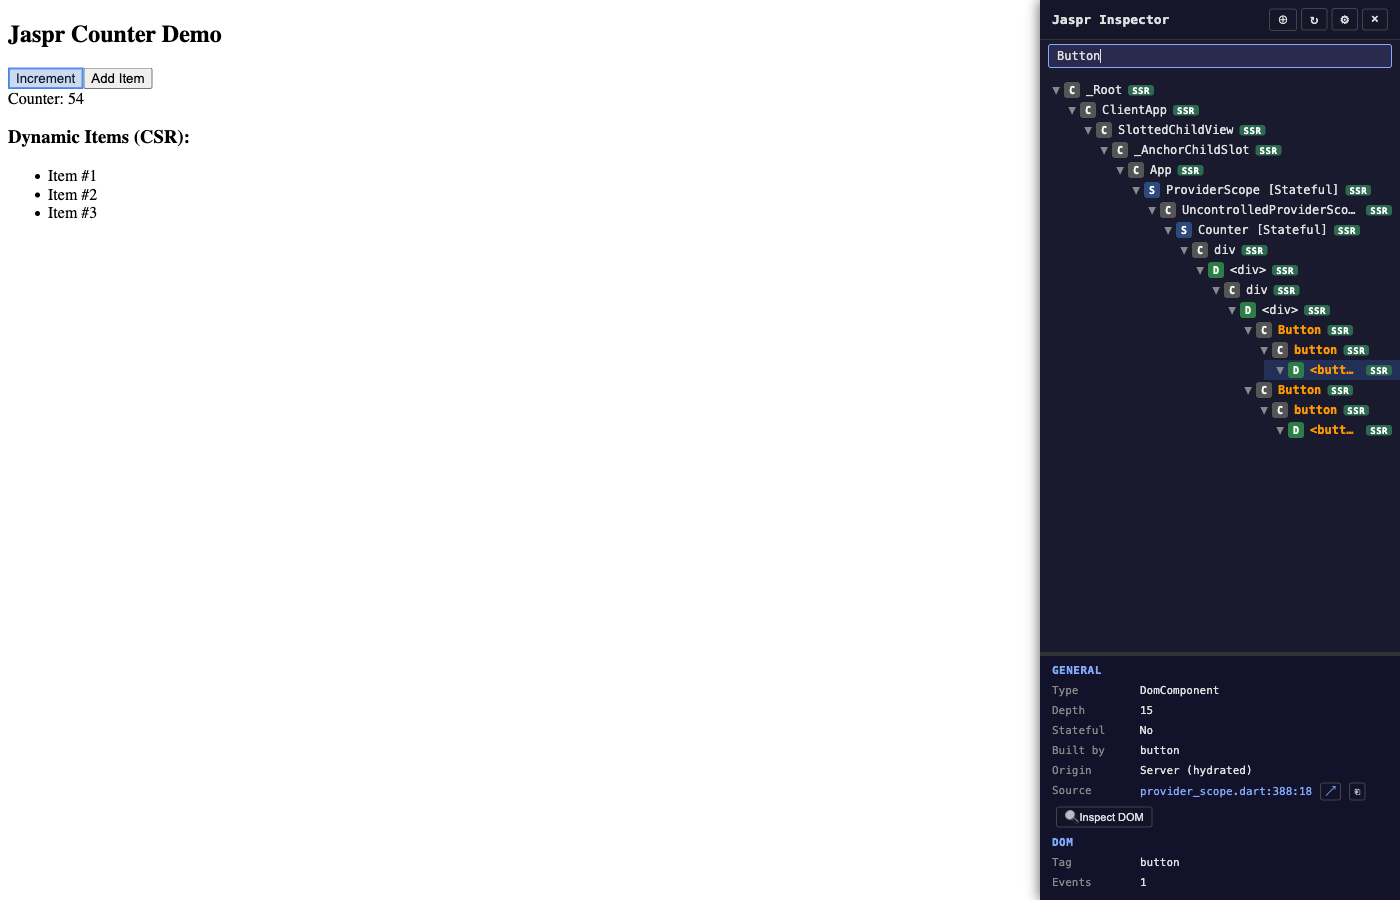
3. Component Search / FilterTyping "Button" into the search bar filters the tree to show only matching components (highlighted in orange) and their ancestor chain. Non-matching nodes are hidden.
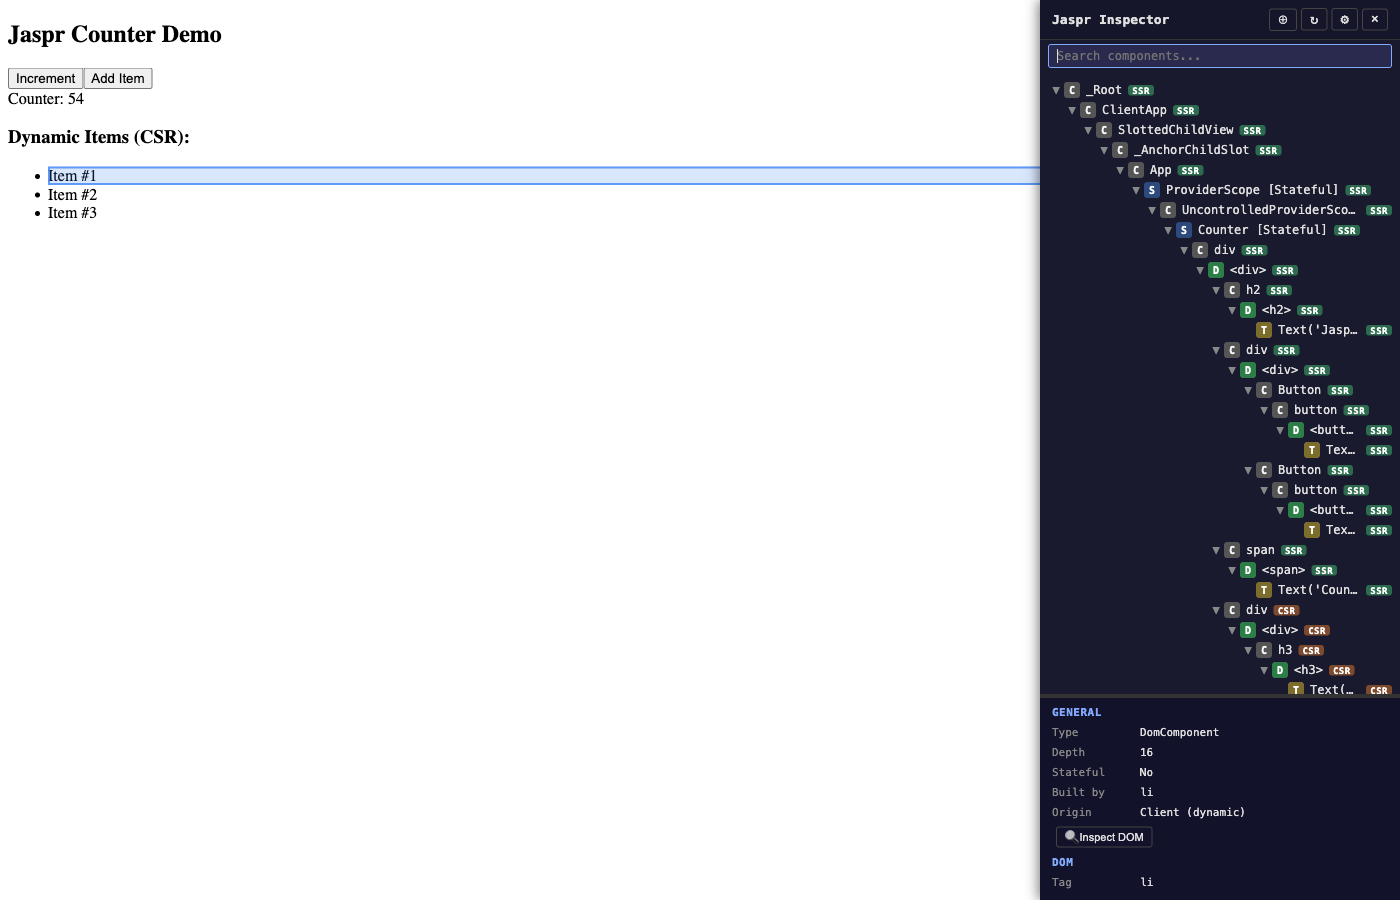
4. Client-Rendered Element DetailSelecting a client-rendered
Screenshots from the |
|
Wow thanks, that looks awesome. Let me try it out a bit and come back to you. |
Summary
Adds an interactive component tree inspector overlay for development builds, toggled with Ctrl+Shift+D. The inspector is fully gated behind
kDebugModeand tree-shaken from release builds.Features
Framework additions (debug-only)
Element.debugCreationStack/debugBuildOwnerElement— tracks which element'sbuild()produced each childRenderObject.debugWasHydrated— distinguishes server-rendered (hydrated) vs client-created DOM nodesState.debugDescribeState()— opt-in hook for exposing state fields to the inspector$jasprProjectInfoserver endpoint — serves package path mappings for "Open in IDE" functionalityFiles
devtools/tree_snapshot.dartInspectorNodetreedevtools/inspector_panel.dartdevtools/inspector_highlight.dartinspect()devtools/source_resolver.dartdevtools/inspector.darttest/devtools/tree_snapshot_test.dartVersioning
CHANGELOG.md updated to
Unreleased minor— this adds new debug-only API surface (debugDescribeState,debugWasHydrated,debugCreationStack,debugBuildOwnerElement).Test plan
dart test packages/jaspr/test/devtools/)dart test packages/jaspr/test/)dart analyzeclean on bothjasprandjaspr_clipackages