-
Notifications
You must be signed in to change notification settings - Fork 9
Embedded Monitoring Dashboard
vzakaznikov edited this page Aug 30, 2025
·
7 revisions
| ✅ Available: | >= 1.8 |
|---|
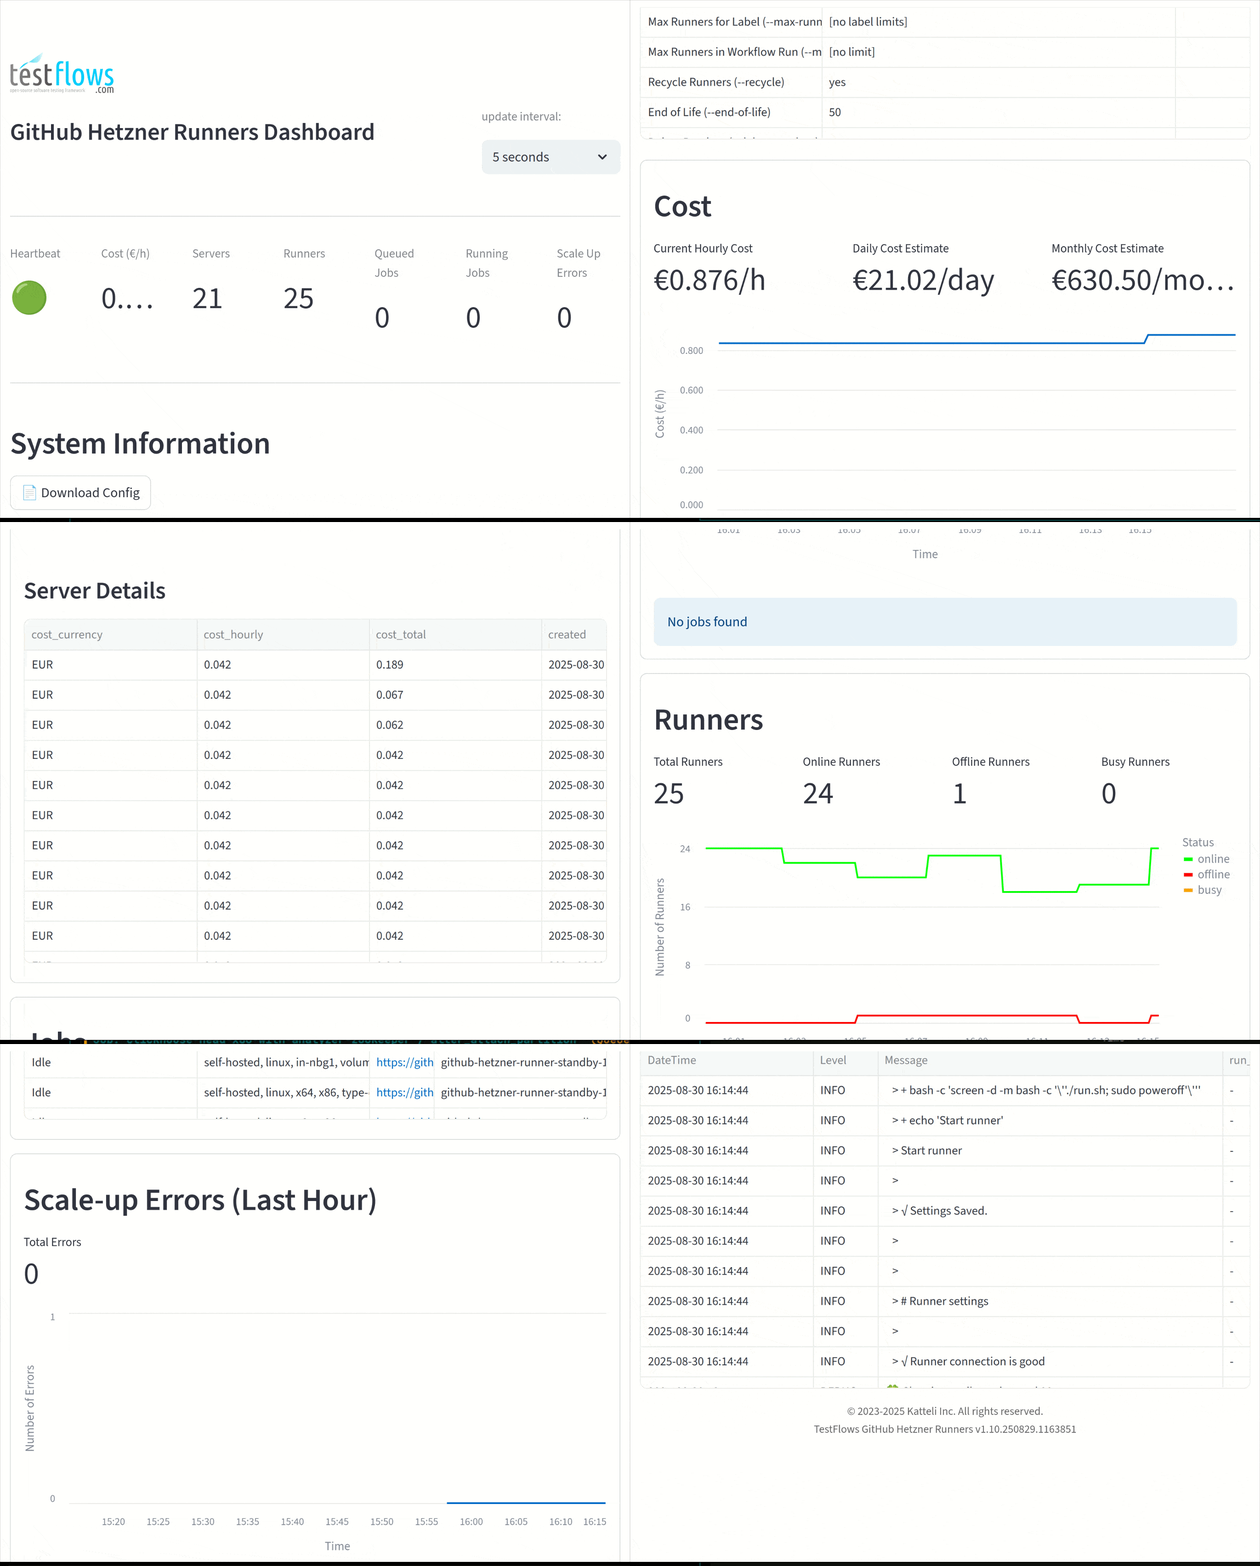
An embedded monitoring dashboard is accessible through a web browser. The dashboard is automatically tunneled through SSH, ensuring secure access without exposing ports to the internet.
| ❗Warning: | The dashboard is using Flask's development server which is not meant to be exposed to the internet
and therefore by default the dashboard is only exposed on the 127.0.0.1 (localhost) interface on the default 8090 port. |
|---|
The dashboard can be accessed using the following commands:
- dashboard - Opens the dashboard for the local service
- cloud dashboard - Opens the dashboard for the cloud service
- cloud --host <IP> dashboard - Opens the dashboard for a specific cloud service by IP address
| ✋ Note: | When using cloud --host <IP> dashboard, the Hetzner API key is not required. However, the user's SSH key must be configured using either the ssh-key or additional-ssh-keys options. |
|---|
Below is a demonstration of the dashboard monitoring runners for the altinity/clickhouse-regression project.

The dashboard provides real-time monitoring of:
- Gauges
- Service heartbeat
- Cost per hour (€/h)
- Total servers
- Total runners
- Queued jobs
- Running jobs
- Scale-up errors
- System Information
- Service configuration and settings
- Cost Monitoring
- Real-time cost per hour tracking
- Historical cost trends
- Server Management
- Server status (running, off, initializing, ready, busy)
- Server details and state visualization
- Runner Monitoring
- Runner status (online, offline, busy)
- Runner details and state visualization
- Job Tracking
- Queued and running jobs
- Job wait times, run times, and labels
- Job status visualization
- Error Monitoring
- Scale-up errors in the last hour
- Error details and visualization
- Log Messages
- Last 100 log messages
- Download full log file
Developed and maintained by the TestFlows team.
- Home
- Installation
- Quick Start
- Getting Started Tutorial
- Basic Configuration
- Specifying the Maximum Number of Runners
- Specifying the Maximum Number of Runners Used in Workflow a Run
- Recycling Powered‐Off Servers
- Skipping Jobs
- Using Custom Label Prefix
- Jobs That Require the Docker Engine
- Specifying The Runner Type
- Specifying The Runner Location
- Specifying The Runner Network
- Specifying The Runner Image
- Specifying The Custom Runner Server Setup Script
- Specifying The Custom Runner Server Startup Script
- Disabling Setup or Startup Scripts
- Specifying Standby Runners
- Using Caching Volumes
- Specifying Logger Configuration
- Listing All Current Servers
- Opening The SSH Client To The Server
- Deleting All Runners and Their Servers
- Using a Configuration File
- Using Project Configuration Files
- Specifying SSH Key
- Specifying Additional SSH Keys
- Running as a Service
- Running as a Cloud Service
- Scaling Up Runners
- Scaling Down Runners
- Handling Failing Conditions
- Meta Labels
- Estimating Costs
- Listing Images
- Deleting Images
- Creating Custom Images
- Embedded Monitoring Dashboard
- Prometheus Metrics
- Program Options