Amazon Archeological Site Discovery – A Deep Learning Approach
The Amazon rain forest, covering more than 6 million kilometer square, was considered as an area with rare human activity in the Pre-Columbian era. But, more and more evidence indicated there were human civilizations nurtured in this land. However, the land is covered by high-density rain forest and it makes discovery of archaeological sites extremely difficult. Besides, since human-built structures in Pre-Columbian era were mostly built from organic materials and those structures have been rotten over the years, especially Amazon has one of the highest decomposition rates in the world[1], it makes Pre-Columbian human activity in Amazon rain forest even harder to detect. Fortunately, the recent advancement of technology on geo sensing and machine learning have potential to make the discovery much more efficient. And this write-up would focus on utilizing a deep learning approach on LiDAR data and satellite image to discover potential pre-columbian archaeological sites hidden under the dense canopy of the Amazon rain forest.
LiDAR technology has been used in discovering and analyzing Pre-Columbian archaeological sites in Amazon rain forest[2]. Researchers can collect high-precision LiDAR data on one area and quickly determine if there is undiscovered site. However, LiDAR data were still analyzed by researchers to detect the pattern and it is hard to scale this effort since knowledgeable archaeologists can be a bottleneck resource to analyze huge areas like the Amazon rain forest.
Machine learning is also being used in discovering archaeological sites[3]. This paper utilized Random Forest to implement a classifier to calculate the possibility of different types of archaeological sites(ADE and earthwork) or negative cases. This approach utilized different geospatial variables as predictors like soil, distance to river and climate. However, this approach has the limitation that its data sources are too coarse. For example, Harmonized World Soil Database v 1.2 is a 30 arc-second database which corresponds to 1 kilometer resolution near the equator. It is much coarser than the LiDAR(30 meter) and satellite image(10 meter) used in this project and would cause more false-negative cases that impact the accuracy.
After evaluation, deep learning was selected as our approach to discover the archaeological site in the Amazon Rainforest due to its leading performance on image classification and wide use in scientific research. LiDAR and Satellite data would be used for training a classifier model to classify if an area has an archaeological site or not. Then this model would be used for scanning the whole Amazon area and finding coordinates with high possibility of having a site. Finally, all the results would be analyzed and filtered by team members and some promising locations would be showcased in the next section.
To prepare training data, both positive and negative samples are collected. 4067 positive samples were collected from 6 different public datasets[5][6][7][8][9][10](Table 1) on discovered archaeological sites. For negative case, 4067 random coordinates were generated based on following rules:
- All coordinates fall on boundary of Amazon Biome
- All negative samples at least have 2 kilometers apart from known positive samples
- Utilizes a grid-based partitioning and stratified random sampling strategy to ensure balanced point coverage amount in Amazon Biome to prevent regional bias in model learning.
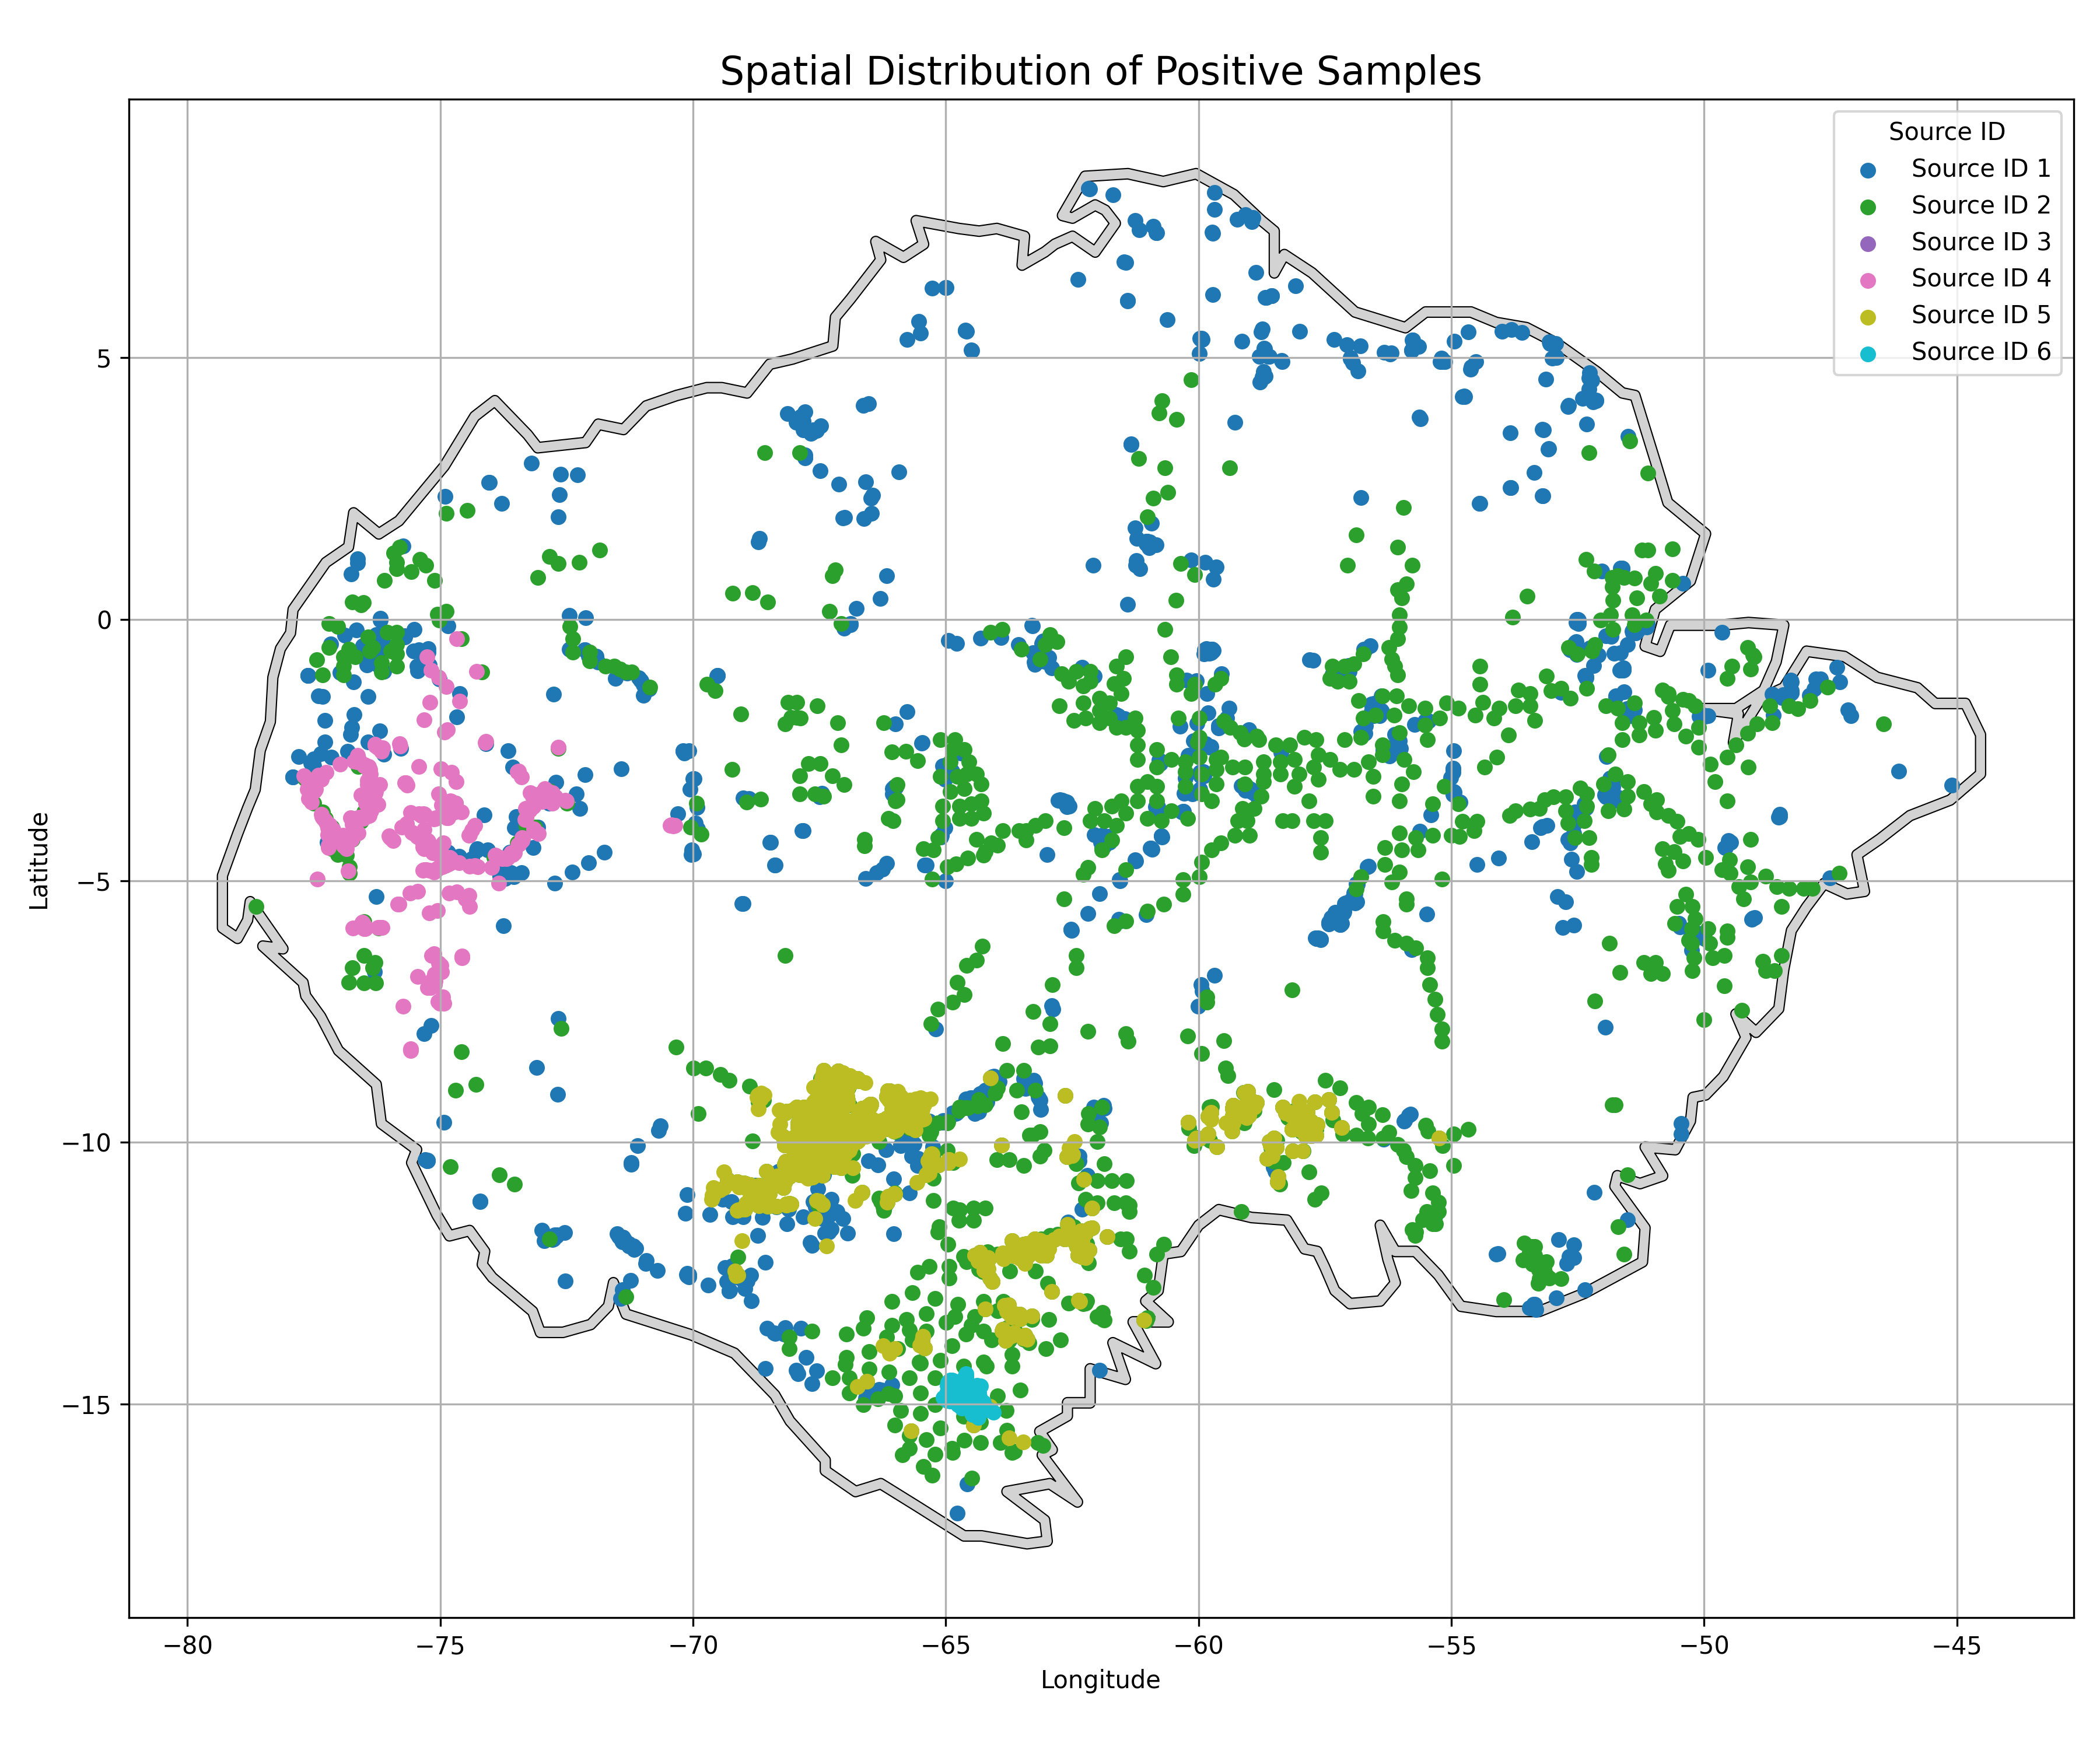
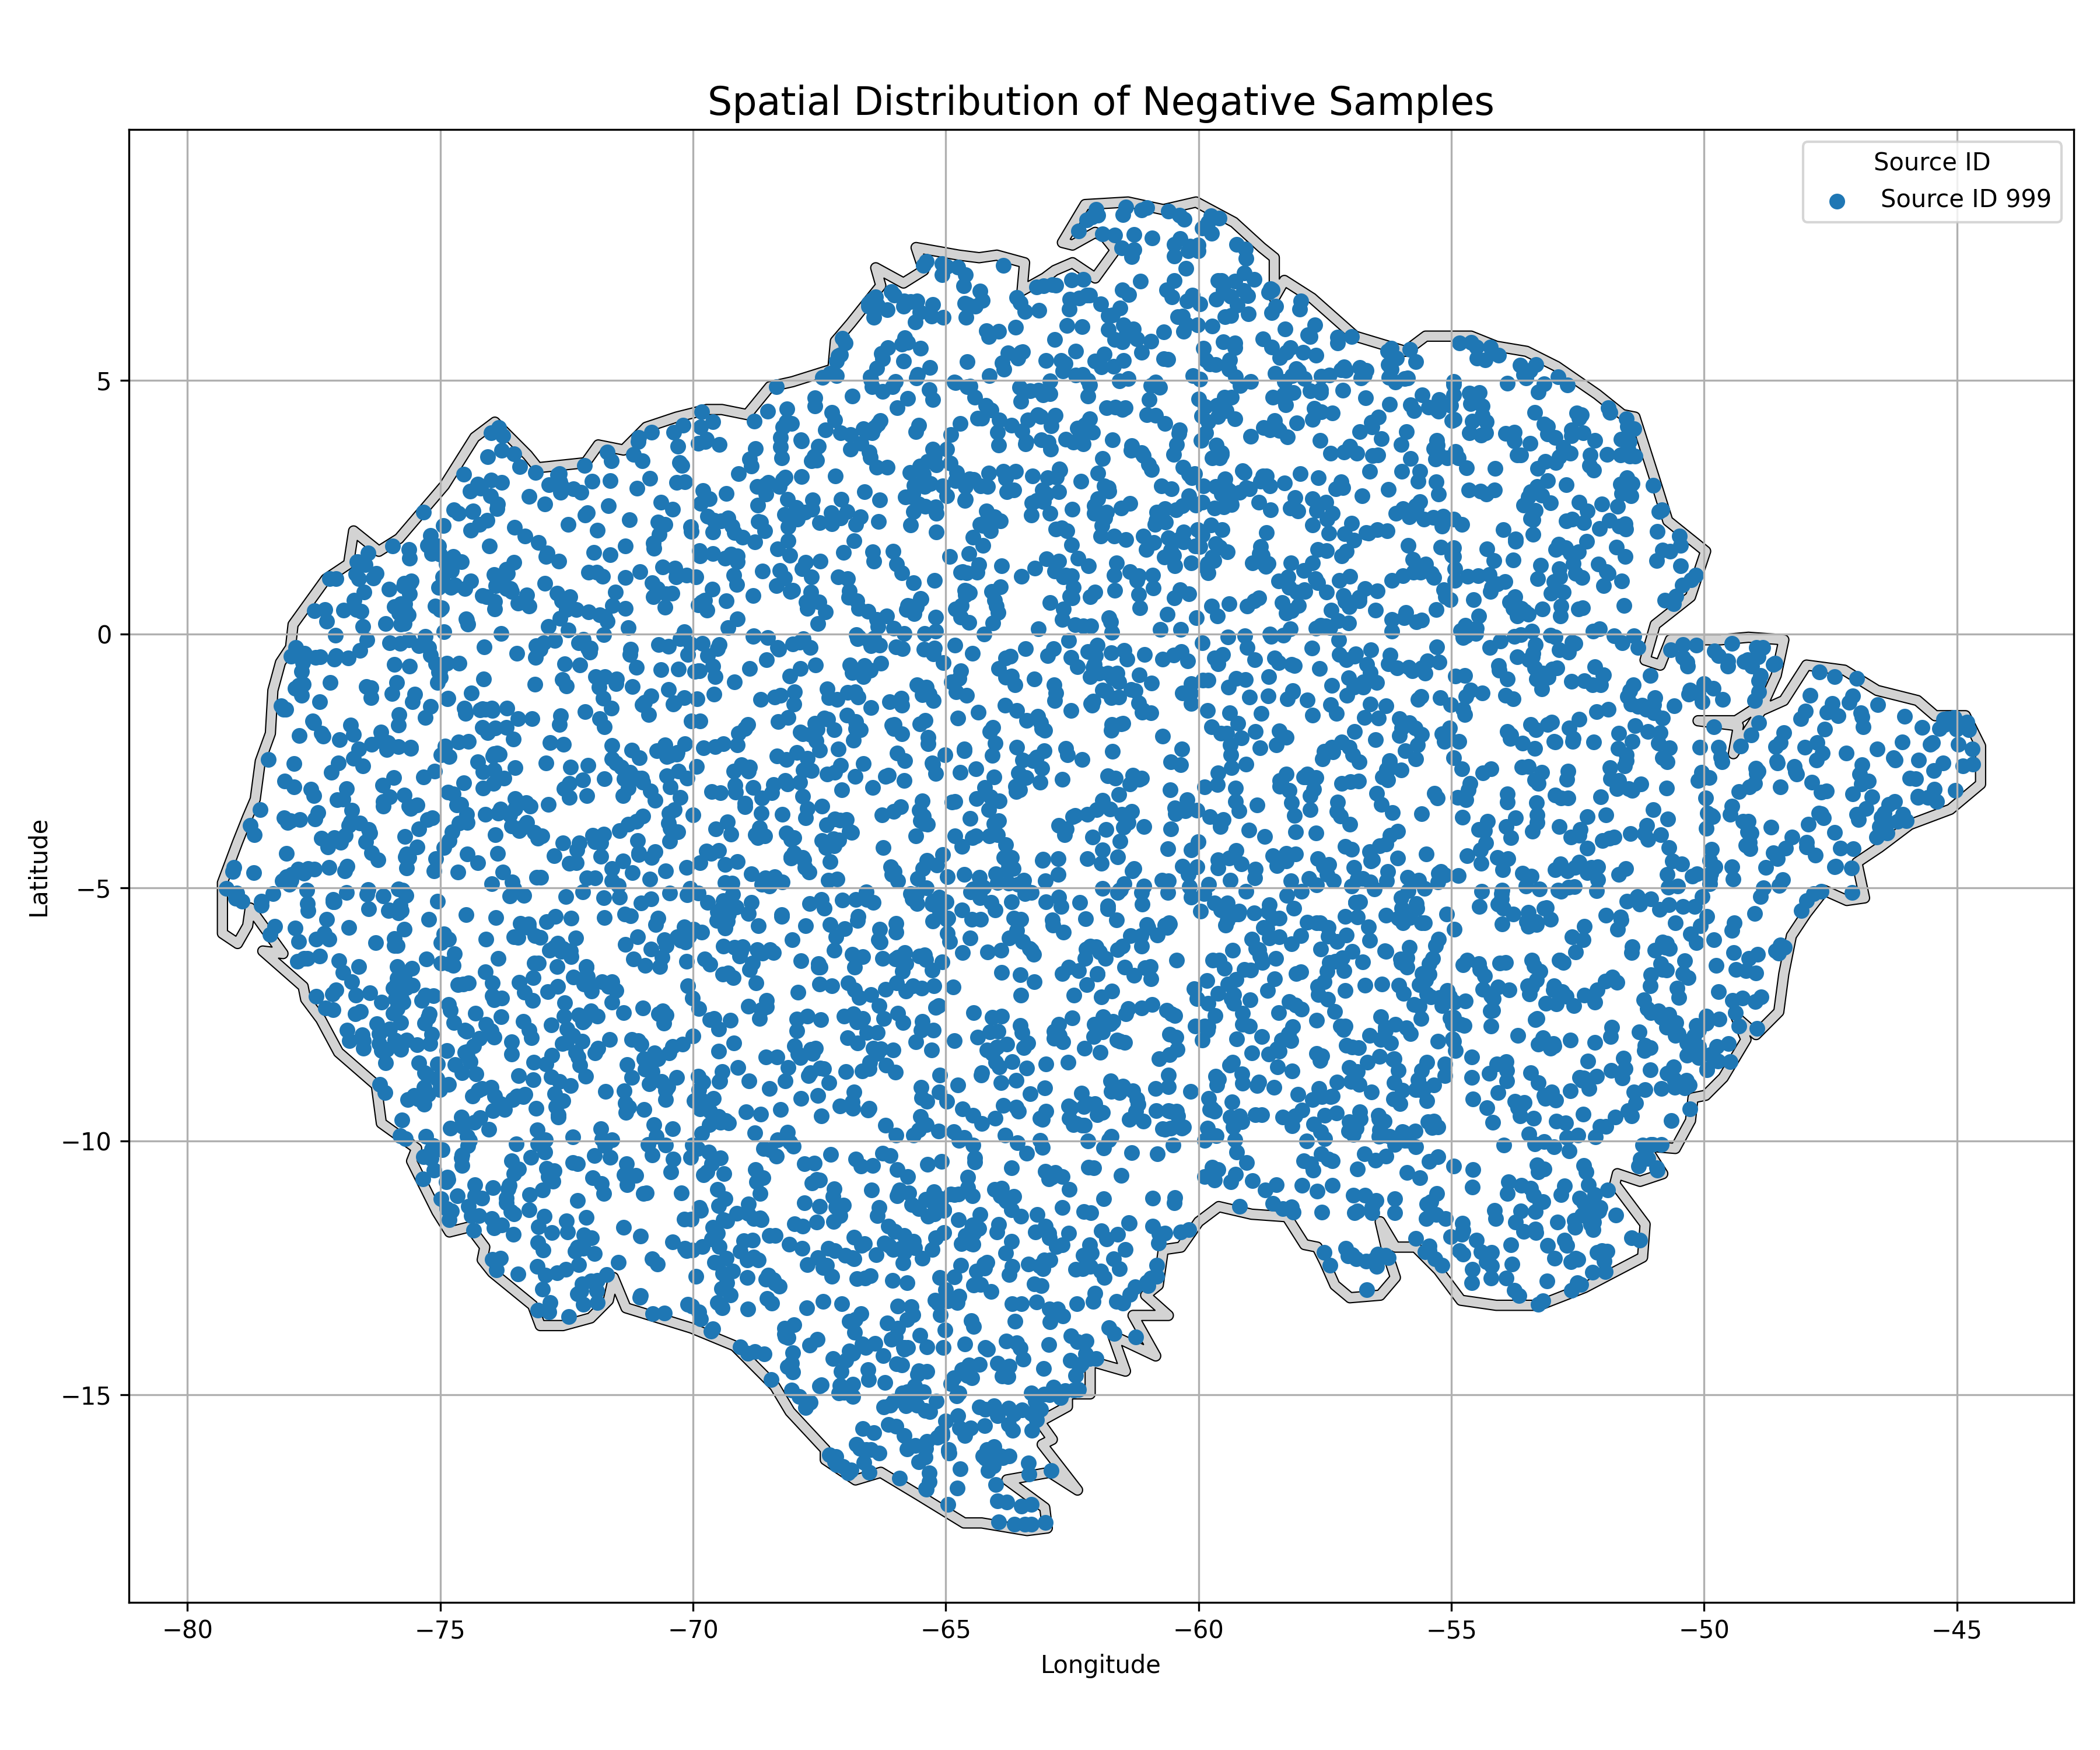
Table 1 Source of documented archaeological site
For LiDAR data, NASADEM(NASA / NASADEM_HGT/001) database was used as a data source of the elevation through Google Earth Engine. The pixel size is 30 meter and for each coordinates on the sample, a patch with size 64 * 64 was extracted. That gives a patch around 2km * 2km area. Apart from raw elevation data, other 4 attributes were also derived from the raw elevation data. Following are all the derived attributes:
- Gaussian Smoothing with standard deviation
σ=10:G(x, y) = GaussianFilter(E_norm, sigma=10) - Slope Magnitude:
grad_x, grad_y = np.gradient(G)S(x, y) = sqrt(grad_x² + grad_y²) - Laplacian: L(x, y) = laplace(G)
- Local Standard Deviation with 5 x 5 window:
mean = uniform_filter(G, size=5)mean_sq = uniform_filter(G², size=5)std_local = sqrt(max(0, mean_sq - mean²))
Those 4 derived metrics and raw elevation composed a 5-band patch for training and validating purposes.
For satellite image, Sentinel-2 database(COPERNICUS/S2_SR_HARMONIZED) was used through Google Earth Engine. B4(Red), B3(Green), B2(Blue) and B8(NIR, near-infrared) were collected forming the 4-band data. The pixel size is 10 meter and patches with size 206 * 206 were extracted for each sample. So the patch is around 2km * 2km in real-world size. During collection, to mitigate the impact of cloud, all images for each coordinate taken in 2024 were sorted by the amount of cloud attribute(CLOUDY_PIXEL_PERCENTAGE) and the data with the least cloud was picked.
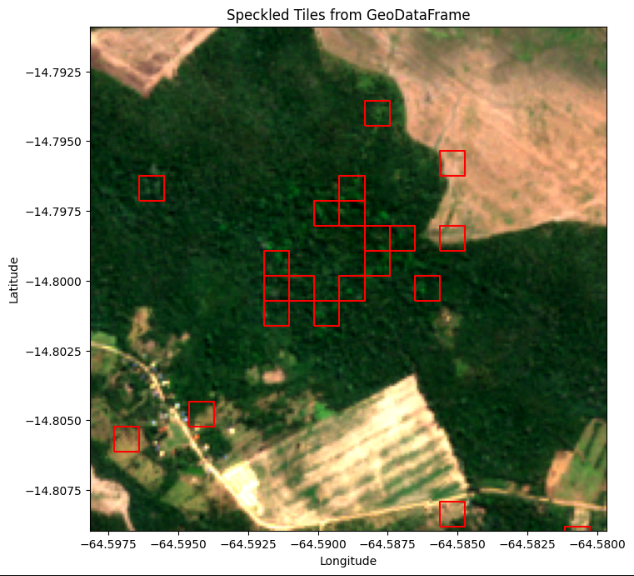
The B8 band from Sentinel-2 data set was used to calculate the speckle point indicator in the image. The appearance of speckle point have close correlation with existence of archeological site.
Both NASDEM and Sentinel-2 data are in GeoTIFF format for transformation between local index and coordinates during training and validation.
Several different machine learning models/approaches were evaluated and Resnet18[4] showed an advantage over other machine learning approaches. With various optimization techniques, Resnet18 achieved high accuracy on image classification. And Resnet is also widely used in the real world for classification tasks. And in the implementation of Resnet18, it has multi-layer Convolutional Neural Network(CNN) structures and CNN specifically has the advantage of recognizing patterns within the images regardless of its location. This characteristic makes Resnet18 a good fit for recognizing patterns of archaeological sites on LiDAR data and Satellite images.
There are also two different approaches on training:
- Mixing NASDEM and Sentinel-2 data to train them together on one Resnet18 model
- Train NASDEM and Sentinel-2 separately on two different Resnet18 models.
Finally, approach 2 was selected because:
- LiDAR data and satellite images of archaeological sites have different patterns and the different patterns would make models confused on learning and impact the accuracy.
- After trial on a smaller batch of data, approach 2 achieved better accuracy.
Following techniques were also applied on the training to improve the quality and efficiency on training:
- Weight Decay
- Dynamic learning rate based on accuracy(ReduceLROnPlateau)
- Random drop-off
Both models achieved ~75% accuracy on the NASDEM and Sentinel-2 validation set. Those models are downloadable through Github.
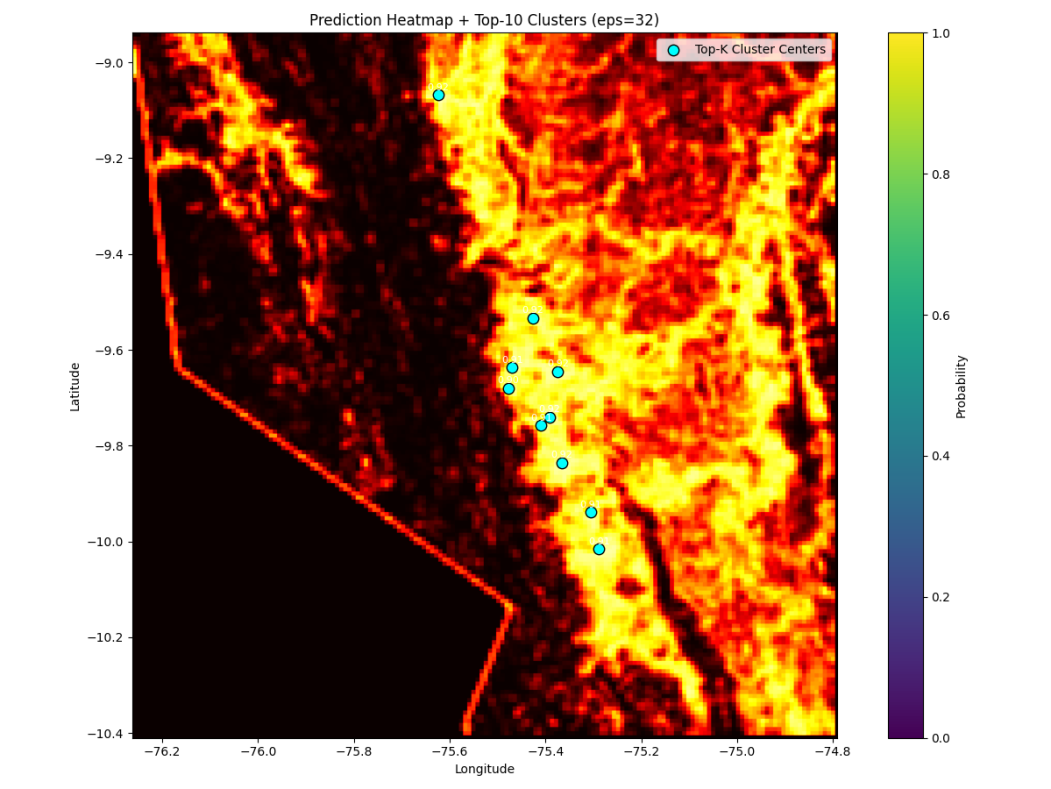
After completing the training stage, two models were used for validation on the NASDEM and Sentinel-2(~700GB) data for the whole Amazon rain forest to search undiscovered archaeological sites. Sliding window algorithms were used for calculating the possibility of a positive case for each window. Each patch size is on 2km * 2km square area and length of the stride for the window is 1km. And only a patch with possibility >0.8 was selected to the final result to reduce the number of false-positive cases. Then the DBSCAN algorithm was used to cluster the list of coordinates and the mean value of coordinates in the cluster was picked as the location of the positive case.Finally the coordinate results from both models were filtered by the logic that the coordinate must be at least 2km apart from documented archaeological sites in the training data.
After filtering and clustering, the results from two models were collected as two csv files with two lists of coordinates and the two lists were ready for pairing. The pairing logic is as following:
- Coordinates from NASDEM and Sentinel-2 results must be at most apart from 2km
- One NASDEM coordinate can only pair with one and only one Sentinel-2 coordinate.
After the combination, only 67 coordinates were selected as output. For each coordinate, 2km * 2km NASDEM and Sentinel-2 images were downloaded and manually analyzed by the team members. Following are the showcase of X coordinates with the most potential to be undiscovered archaeological site within Amazon rain forest:
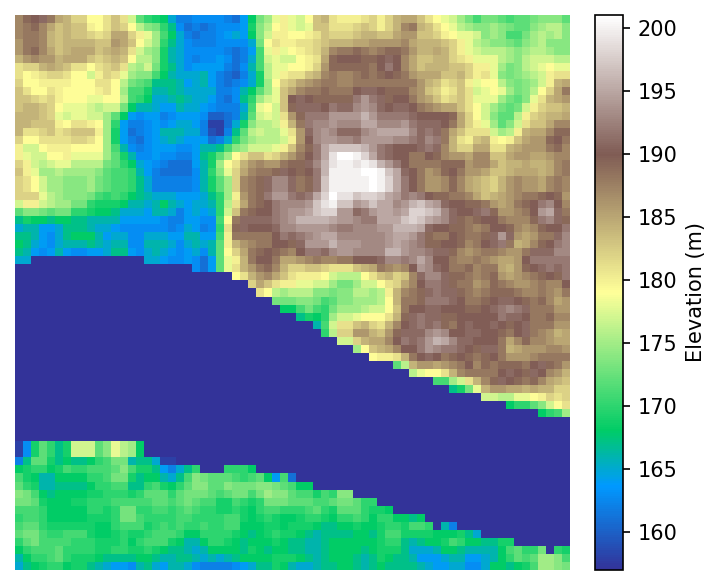
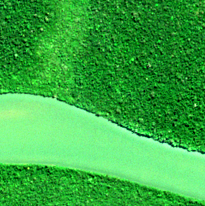
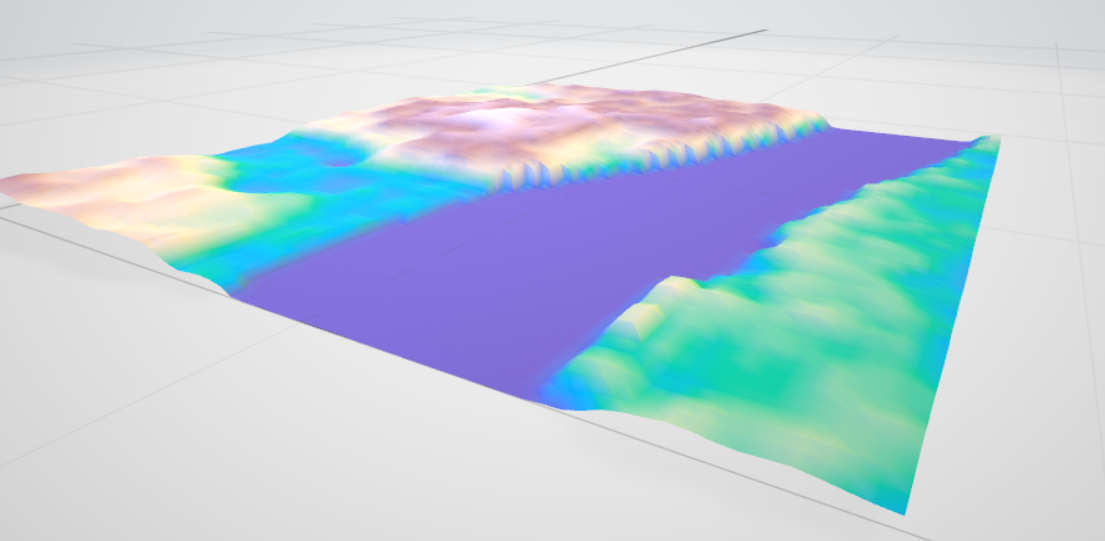
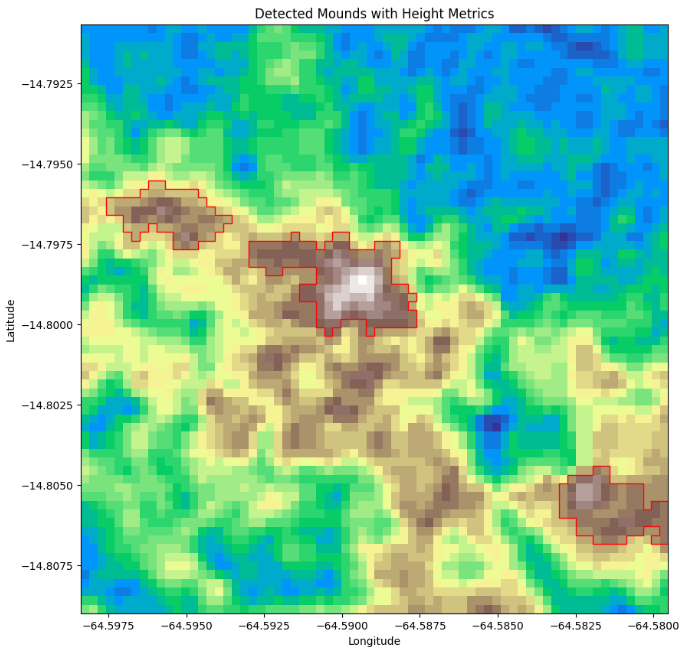
Figure 6: NASDEM, Sentinel-2 and 3D image 2km * 2km
This location sits along the Xingu River, where many archaeological sites are located. There are a few speckle points spotted on the Sentinel-2 image and the radiating pattern on the up-right side of the NASDEM image is very similar to some in the discovered sites.
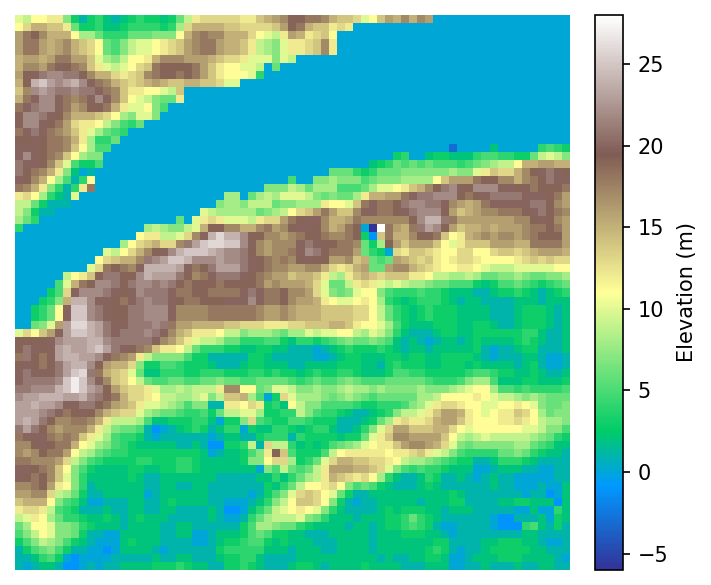
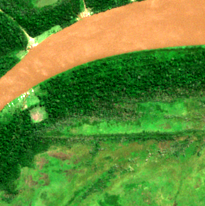
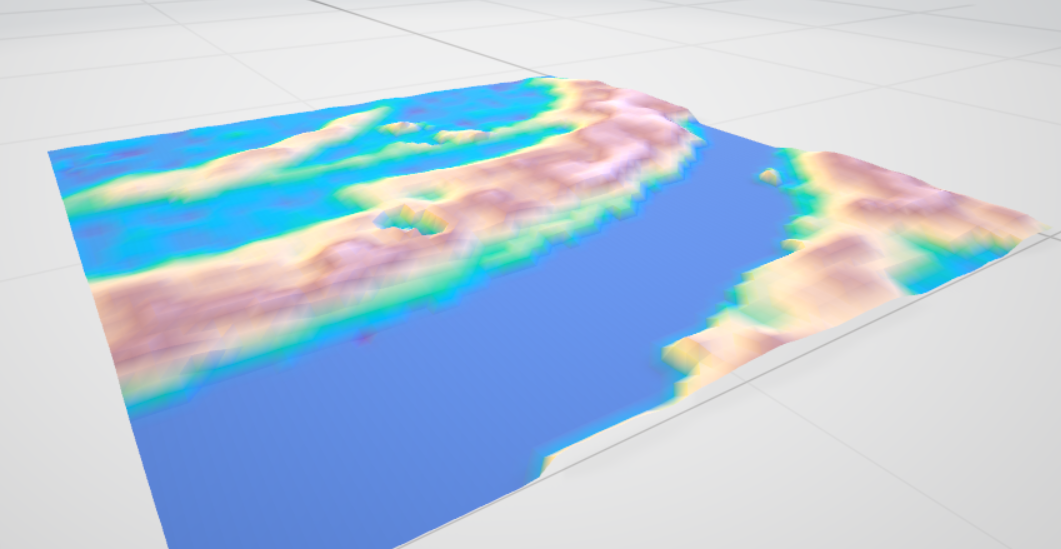
Figure 7: NASDEM, Sentinel-2 3D image 2km * 2km
In the Sentinel-2 image, there is an obvious square shape on the left side of the image. It might indicate there was human activity in this area. And there is a narrow ridge that can mitigate the impact of flooding the south bank and this is an idea location for human settlement in the Pre-Columbus era.
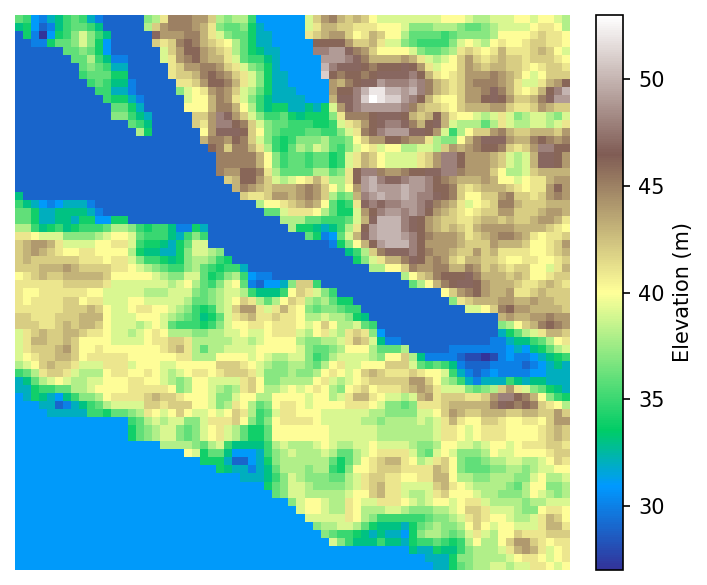
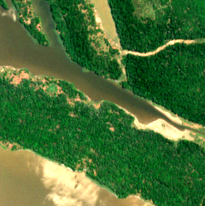
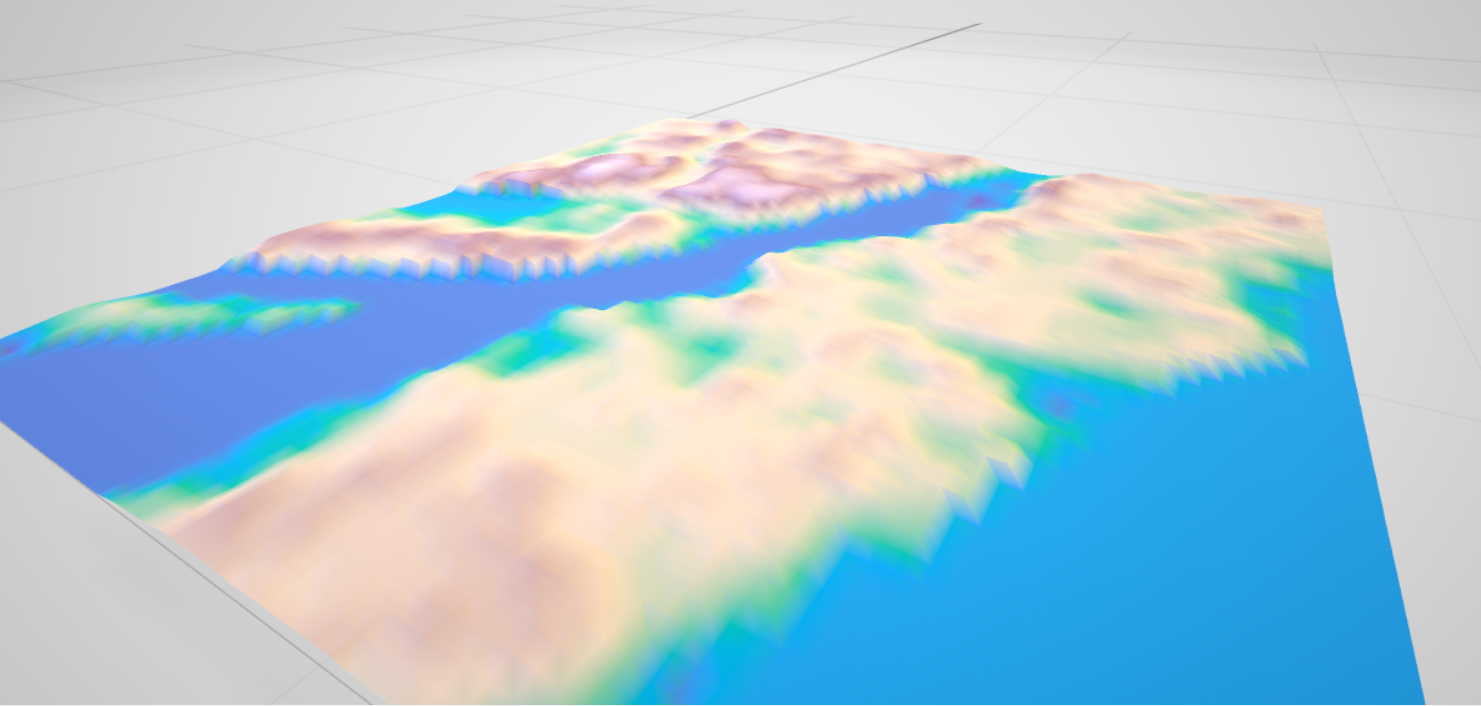
Figure 8: NASDEM, Sentinel-2 3D image 2km * 2km
Similar with the location #1493, this location also included a smaller radiating pattern on the up-right part of the NASDEM picture. On the Sentinel image, there is a linear clearing and canopy gap on the north side of the image that indicates past human activity in this area. And this location is also an ideal place because of its relatively high elevation and short distance to the river.
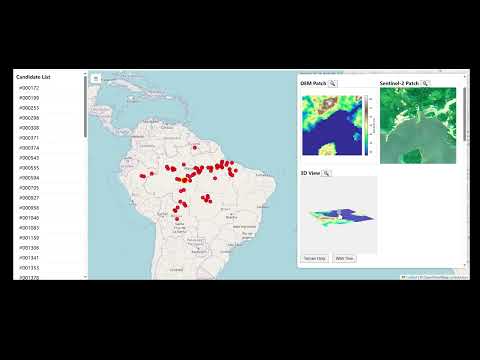
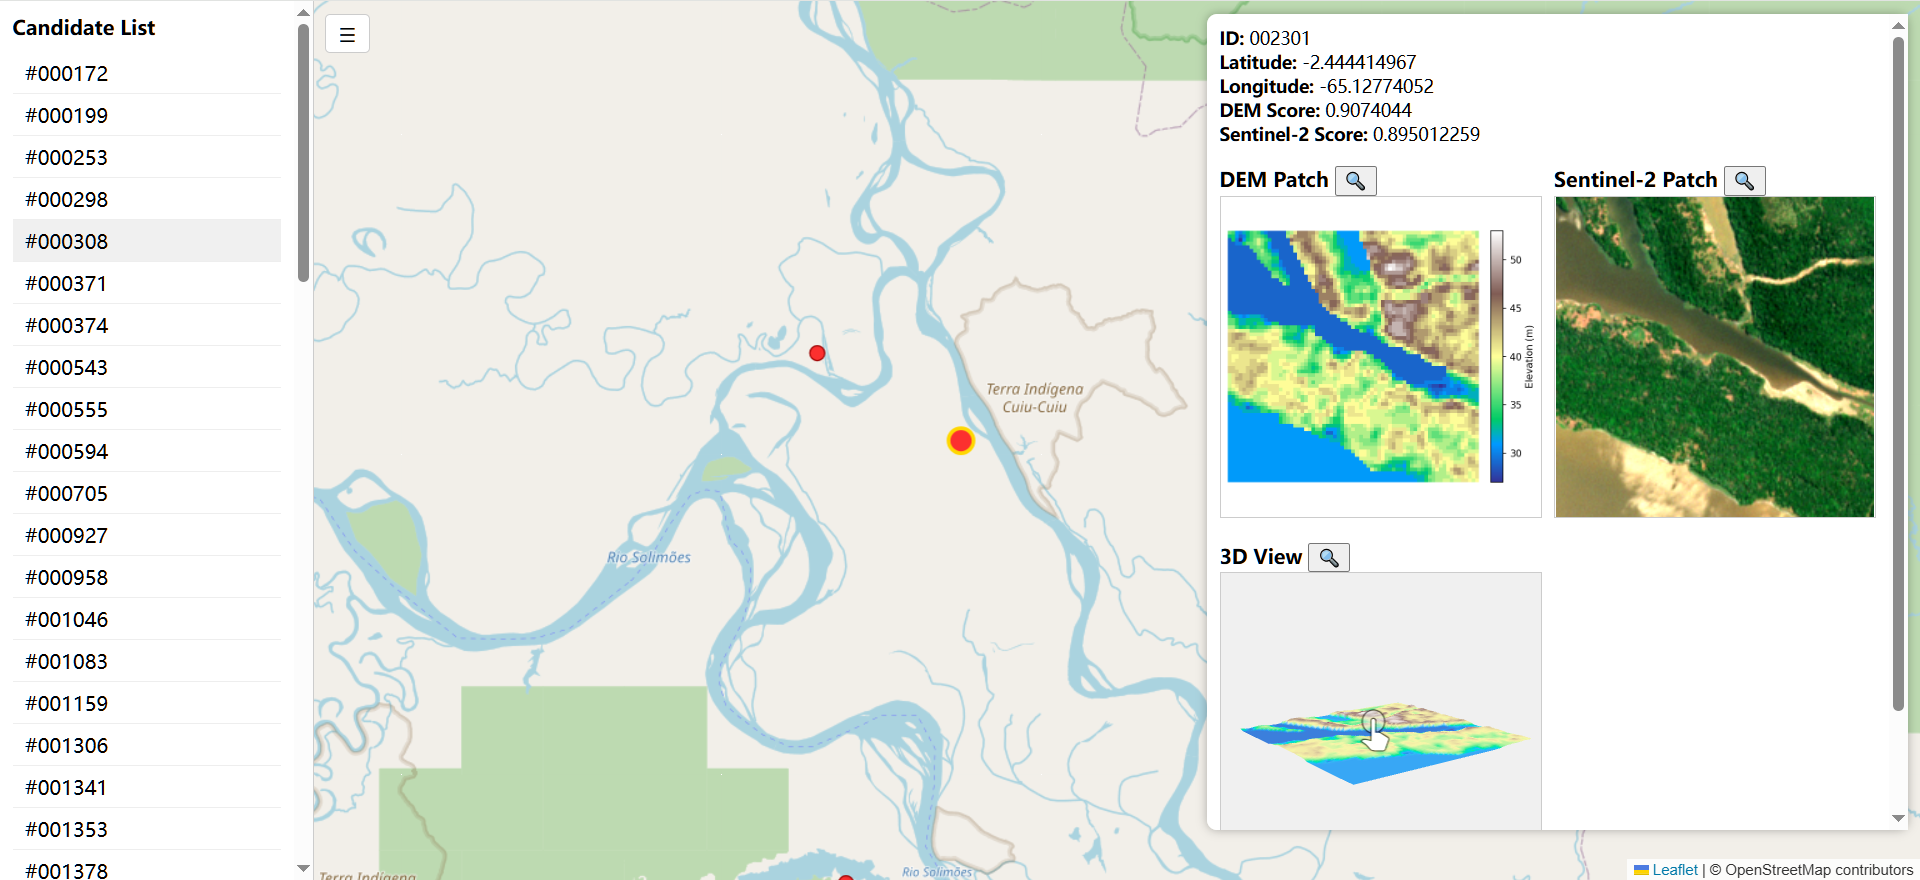
To better visualize the result, a website is created to display all the coordinates in the result section on the real-world map. For each coordinate, it shows 2km * 2km Sentinel image, 2km * 2km NASDEM image, 3D model based on elevation and a brief description generated from ChatGPT. Website: https://tianmiao11.github.io/amazon-archaeology-explorer/
- Because of a lack of archaeological knowledge and short timeline of the competition, training data was not supervised by team members and only relied on public dataset. If the quality of the training data can be improved, the accuracy of each model can be also improved and the model can achieve better accuracy.
- Besides LiDAR and satellite image, other geographic variables like soil and climate metrics can be used as predictors in the training and discovering stage. Those can be added as extra bands along with LiDAR data to produce a model with higher accuracy.
- There is human involvement on many documented sites in positive samples from public databases and that could make the pattern on satellite images different from undiscovered sites. That could impact the accuracy during validation. To mitigate the impact, a more strict filtering should be applied on the training data to filter out the Post-Columbus human activity.
Due to time constraints of the competition, we managed to complete a basic deep learning training flow. But during the research, we saw the potential of deep learning to help archeologists to discover sites much more efficiently, compared to the traditional approaches. And we strongly believe that deep learning can benefit a broader scope of archeological discovery.
[1] de Souza, J. G. (2014). Nutrient Cycling in the Amazon: A Review of the High Decomposition Rates and Soil Fertility Implications. SIT Graduate Institute. Retrieved from https://digitalcollections.sit.edu/isp_collection/2339
[2] Khan, S., Aragão, L., & Iriarte, J. (2017). A UAV–lidar system to map Amazonian rainforest and its ancient landscape transformations. International Journal of Remote Sensing, 38(8–10), 2313–2330. https://www.tandfonline.com/doi/abs/10.1080/01431161.2017.1295486
[3] Robert S. Walker, Jeffrey R. Ferguson, Angelica Olmeda, Marcus J. Hamilton, Jim Elghammer & Briggs Buchanan. (2023) Predicting the geographic distribution of ancient Amazonian archaeological sites with machine learning. PeerJ 11, pages e15137. https://peerj.com/articles/15137/
[4] He, K., Zhang, X., Ren, S., & Sun, J. (2016). Deep residual learning for image recognition. Proceedings of the IEEE Conference on Computer Vision and Pattern Recognition (CVPR), 770–778. https://doi.org/10.1109/CVPR.2016.90
[5] Prümers, H., Robinson, M., Alves, D., et al. (2023). More than 10,000 pre-Columbian earthworks are still hidden throughout Amazonia. Science, 379(6637), 1347–1351. https://doi.org/10.1126/science.ade2541
[6] Levis, C., Silva, T. S. F., Costa, F. R. C., et al. (2023). Predicting the geographic distribution of ancient Amazonian archaeological sites with machine learning. PeerJ, 11, e15137. https://doi.org/10.7717/peerj.15137
[7] Hesse, R., & Moraes, C. D. P. (2021). Geometry by design: Contribution of lidar to the understanding of settlement patterns of the mound villages in SW Amazonia. Journal of Computer Applications in Archaeology, 4(1), 61–76. https://doi.org/10.5334/jcaa.45
[8] Watling, J., Iriarte, J., Robinson, M., et al. (2021). Geolocation of unpublished archaeological sites in the Peruvian Amazon. Scientific Data, 8, Article 157. https://doi.org/10.1038/s41597-021-01067-7
[9] Jacobs, J. Q. (n.d.). Hundreds of Geoglyphs Discovered in the Amazon. Retrieved from https://jqjacobs.net/archaeology/geoglyph.html
[10] Prümers, H., Robinson, M., Mologni, F., et al. (2022). Lidar reveals pre-Hispanic low-density urbanism in the Bolivian Amazon. Nature, 606(7912), 325–328. https://www.ncbi.nlm.nih.gov/pmc/articles/PMC9177426
This project is licensed under the Creative Commons Attribution 4.0 International License.